By agreement with the publisher, this book is accessible by the search feature, but cannot be browsed.
Copyright © 2003, BC Decker Inc.
Bookshelf ID: NBK12815

An official website of the United States government

NCBI Bookshelf. A service of the National Library of Medicine, National Institutes of Health.
Kufe DW, Pollock RE, Weichselbaum RR, et al., editors. Holland-Frei Cancer Medicine. 6th edition. Hamilton (ON): BC Decker; 2003.

Pharmacokinetics is the study of drug absorption, distribution, metabolism, and excretion (Figure 46-1). A fundamental concept in pharmacokinetics is drug clearance, that is, elimination of drugs from the body, analogous to the concept of creatinine clearance. In clinical practice, clearance of a drug is rarely measured directly but is calculated as either of the following:


Schematic representation of pharmacokinetics and pharmacodynamics. Pharmacokinetics represents the absorption, distribution, metabolism, and elimination of drugs from the body. Pharmacodynamics describes the interaction of drugs with target tissues. GI (more...)
AUC, the area under the curve, represents the total drug exposure integrated over time and is an important parameter for both pharmacokinetic and pharmacodynamic analyses. As indicated in equation 1, the clearance is simply the ratio of the dose to the AUC, so that the higher the AUC for a given dose, the lower the clearance. If a drug is administered by continuous infusion and a steady state is achieved, the clearance can be estimated from a single measurement of the plasma drug concentration (Css) as in equation 2.
Clearance can conceptually be considered to be a function of both distribution and elimination. In the simplest pharmacokinetic model,
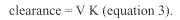
V is the volume of distribution, and K is the elimination constant. V is the volume of fluid in which the dose is initially diluted, and thus the higher the V, the lower the initial concentration. K is the elimination constant, which is inversely proportional to the half-life, the period of time that must elapse to reach a 50% decrease in plasma concentration. When the half-life is short, K is high and plasma concentrations decline rapidly. Thus both a high V and a high K result in relatively low plasma concentrations and a high clearance.
Although pharmacokinetic analysis can be conducted without specifying any mathematical models (noncompartmental methods), it is helpful to use such models as guides in therapeutic decision making. There are several important characteristics of drugs that have linear pharmacokinetics (Table 46-2). The key feature of a linear pharmacokinetic model is that

Characteristics of Drugs with Linear Pharmacokinetics.
This indicates that the instantaneous rate of change in drug concentration depends only on the current concentration. The half-life will remain constant, no matter how high the concentration.
One implication of this principle is that the drug exposure (AUC) is not affected by changes in drug schedule. For example, the AUC after a 60 mg/m2 bolus dose of doxorubicin equals the total AUC for 3 daily (or weekly) bolus doses of 20 mg/m2, which equals the AUC for the same dose administered as a 96-hour infusion. A second implication is that the AUC is proportional to the dose. Thus, if one measures the AUC for a 60 mg/m2 dose, one can estimate the AUC for a 90 mg/m2 dose in the same patient as being 50% greater.
The simplest linear pharmacokinetic model, shown graphically in Figure 46-2, is
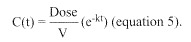

Concentration-time plot for 1-compartment linear pharmacokinetic mode. C0 represents the initial concentration, assuming instantaneous administration and distribution. The half-life is loge(2)/k. V = .
This model assumes that the drug is administered as an instantaneous bolus and that complete distribution of the drug is also instantaneous.
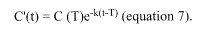
These assumptions are often not valid. If the drug is administered as a slow bolus or infusion, the model must be corrected for the infusion duration. During the administration of the drug, the concentration is increasing:

After the infusion is terminated, the drug concentration decays at the same rate as if it had been administered as an instantaneous bolus. Thus, if T represents the infusion time, then the postinfusion drug concentrations can be represented as
Often, the pharmacokinetic data are more complex than those shown in Figure 46-2 and may be optimally fitted to a multicompartment model, usually two or three compartments (Figure 46-3). It must be emphasized that the compartments are theoretical, so they do not necessarily correlate with any anatomic space or physiologic process.

Concentration-time plots for representative 2-compartment (A) and 3-compartment (B) linear pharmacokinetic models. The two curves are very similar, with C0 ~10 for both models. Note that for each “compartment” there is one term, and the (more...)
A large variety of computer software is available for pharmacokinetic analysis.107–109 The interested reader is likely to benefit from hands on experience with such programs. Several caveats need to be emphasized for the casual reader. The validity of pharmacokinetic modeling depends to a large extent on the quality of the data entered into the model. Thus, drug infusions must be precisely timed, plasma samples must be obtained on schedule, and analytical methods must be sensitive and specific. The data must be properly weighted to avoid bias due to the increased probability of analytical errors at drug concentrations near the detection limit of the assay. Results obtained using a specific model should be compared to those using noncompartmental methods. Extrapolation of models outside the known time points must be done with great caution.
Nonlinear pharmacokinetic models imply that some aspect of the pharmacokinetic behavior of the drug is saturable. The mathematics of nonlinear models are beyond the scope of this chapter, but the principles are very relevant to several anticancer agents.110,111 In contrast to the administration schedule of drugs with linear pharmacokinetics, alteration of the administration schedule of drugs that display nonlinear kinetics may markedly affect the AUC and potentially alter clinical effects.
Nonlinear pharmacokinetic behavior commonly occurs when there is saturation of a major metabolic pathway. This results in decreased clearance at higher doses, with a greater than proportional increase in the AUC. The AUC will also increase if the infusion duration is shortened, due to slower clearance at the higher peak plasma concentrations. This is clearly the case for 5-FU, probably due to saturation of its conversion to dihydrofluorouracil by the enzyme dihydropyrimidine dehydrogenase.112–115 Schaaf and colleagues demonstrated that doubling of the 5-FU dose from approximately 7.5 mg/kg to 15 mg/kg (by IV bolus) resulted in a 135% increase in the mean AUC.114 Since 5-FU is used on a variety of schedules, its nonlinear pharmacokinetic behavior may be one factor in its highly schedule-dependent effects. Paclitaxel has also been demonstrated to have nonlinear pharmacokinetics.116,117 Thus, the AUC is higher, for a fixed dose, when administered by shorter (3-hour versus 24-hour) infusion schedule, although this does not result in enhanced toxicity.118
The opposite situation arises when a drug's absorption from the gastrointestinal tract (or renal tubular reabsorption) is saturable. In this case, an increase in dose results in a less than proportional increase in the AUC. Gastrointestinal absorption of drugs that resemble natural compounds is frequently mediated by active transport processes that display saturable kinetics. Folate analogs such as MTX or leucovorin and amino acid analogs such as melphalan are examples of drugs with saturable absorption.119–121 Cisplatin appears to have nonlinear pharmacokinetics due to saturation of its renal tubular reabsorption.122,123 Forastiere and colleagues demonstrated that free plasma platinum is increased by 42% when the drug is given as a 24-hour continuous infusion, rather than as a 20-minute infusion.122 Prolonged infusion was also associated with a greater than threefold increase in the free platinum half-life.
In describing a drug's pharmacokinetics, it is important to consider the extent of interpatient variability, often represented as the coefficient of variation (ratio of standard deviation to the mean). Cancer patients may have significant hepatic or renal dysfunction, as well as other abnormalities that lead to alterations in pharmacokinetic parameters (Table 46-3). Identifying genetic differences in drug metabolism may be particularly fruitful in understanding pharmacokinetic variability.124 Such pharmacogenetic variation has been demonstrated to be important in explaining variability observed following administration of 6-mercaptopurine,125,126 5-FU, amonafide,127–129 and irinotecan.130–133
Potential Sources of Interpatient Pharmacokinetic Variability in Cancer Patients.
Studies of interpatient pharmacokinetic variability are potentially of great importance for optimizing antineoplastic therapy. Variability in gastrointestinal absorption is generally not considered in the use of orally administered antineoplastic agents even though drugs such as cyclophosphamide, chlorambucil, melphalan, and etoposide are commonly administered orally for a variety of malignancies.2 The percentage of a drug absorbed is referred to as its bioavailability, that is, the ratio of the plasma AUC after oral administration to the plasma AUC after intravenous administration of the same dose. Bioavailability may be influenced by drug metabolism in the gastrointestinal tract or liver as well as by absorption. The (6S) isomer of leucovorin, for example, has limited bioavailability due primarily to its rapid conversion to 5-methyltetrahydrofolate prior to reaching the systemic circulation.134 By contrast, the bioavailability of (6R) leucovorin is limited primarily by absorption. Bioavailability is often highly variable and unpredictable,25,135–138 and may be accentuated by concomitant administration of other chemotherapeutic agents, particularly those that produce toxicity to the gastrointestinal mucosa.120
Variability in drug distribution may be attributed to changes in body size or to the ratio of fat to total mass.139 In the latter case, there may be altered distribution of lipophilic drugs, which includes most of the natural product anticancer drugs and their analogs. The best described example of abnormal drug distribution is the delayed clearance of methotrexate due to accumulation and slow release of the drug from ascites or pleural effusions.140 The terminal elimination half-lives of doxorubicin, cyclophosphamide, and ifosfamide are prolonged in obese patients.141,142 In the case of doxorubicin and cyclophosphamide this appears to be due to a reduction in clearance, whereas in the case of ifosfamide it is related to an increased volume of distribution of the drug.141
Many patients with advanced cancer have abnormalities of liver function tests or known mass lesions within the liver, often in association with significant malnutrition. Given that many antineoplastic agents are metabolized or excreted by the liver, recognizing altered elimination by the liver becomes important in the optimization of chemotherapy dosing. Unfortunately, altered hepatic elimination or metabolism of drugs is not easily predictable. Clearly, patients with severe hyperbilirubinemia due to parenchymal replacement or obstruction are likely to have altered elimination.143 However, it is not often recognized that many patients with normal serum bilirubin levels may have a low drug clearance resulting in a high AUC and corresponding toxicity. A decrease in serum albumin (in patients with normal serum bilirubin concentrations) has been associated with a decrease in the hepatic elimination of antipyrine, a commonly used marker drug, and of vinblastine and trimetrexate.144–147 Thus, patients with a serum albumin less than 2.5 g/dL may be at increased risk of toxicity and are potential candidates for dose reduction of agents requiring hepatic metabolism or excretion. At present, there are few firm guidelines useful for accurate dosing of antineoplastics in the setting of obvious hepatic disease.148–150
In contrast, alterations in renal function generally correlate with renal clearance of drugs, since renal drug clearance tends to correlate with creatinine clearance. This has been well established for carboplatin, for which a firm relationship exists between renal function and carboplatin clearance. This relationship can be used prospectively to modify the carboplatin dose and avoid excessive toxicity.151–153 In addition, a recent study suggested that dose reduction of topotecan is required in patients with moderate renal dysfunction.154
Abnormalities of protein binding are common, but rarely have an impact on clinical outcome. Many anticancer drugs, such as the Vinca alkaloids and etoposide, are highly protein- bound.143,155,156 Changes in protein binding may affect drug clearance.157 Most importantly, abnormal protein binding must be considered in the interpretation of measured total plasma drug concentrations, since a decrease in protein binding will result in a relative increase in the pharmacologically active free drug.143,158
Although it is well established that interpatient pharmacokinetic variability may be significant, the importance of intrapatient variability (within a single patient) is less clear.159 Oncologists are commonly faced with the clinical situation of increasing myelosuppression after repetitive dosing. This is generally assumed to be due to the cumulative effects of chemotherapy, making the patient more sensitive to subsequent doses. However, it is also possible that the patient's clearance of the drug(s) may have decreased, resulting in increased drug exposure.
Such a situation may arise when either hepatic or renal function changes. Renal function may change due to progressive disease (ureteral obstruction), complications of therapy (volume depletion), or as a direct toxic effect of therapy (cisplatin). Similarly, renal function may improve over time, reducing the actual drug exposure. Hepatic function may also change, producing changes in drug clearance which may result in the appearance of increased toxicity over time, as is the case for VLB administered by prolonged continuous infusion.146 Thus, clinicians should carefully review the outcome of prior doses to minimize the risk of an undesirable outcome due to intrapatient pharmacokinetic variability.
Another potential source of intrapatient pharmacokinetic variability is an individual's circadian rhythm. The best-studied drugs in this regard are 5-FU and 5-fluoro-2′-deoxyuridine.160 Petit and colleagues evaluated circadian variability of 5-FU plasma concentrations during a 5-day infusion at a constant dose and demonstrated a greater than twofold difference between maximum and minimum values.161 Similar results were obtained by Harris and colleagues who demonstrated an inverse correlation between plasma 5-FU concentration and the activity of dihydropyrimidine dehydrogenase, the major catabolic enzyme for 5-FU.162
Despite the fact that anticancer drugs are almost always given as combination chemotherapy, often in conjunction with antiemetics and/or putative modulators, there have been relatively few studies in this area. One well-studied combination is paclitaxel and cisplatin, an important regimen for ovarian cancer, in which cisplatin reduces paclitaxel clearance if given first.163
Studies of modulators of drug reactions have also demonstrated that inhibition of clearance may be an unexpected outcome. Such results have been demonstrated for the effects of cyclosporin A on etoposide164 and doxorubicin165,166 clearances and in the action of interferon alfa on 5-fluorouracil clearance.167
By agreement with the publisher, this book is accessible by the search feature, but cannot be browsed.
Your browsing activity is empty.
Activity recording is turned off.
See more...