Poverty and Chronic Conditions
Poverty is strongly associated with diabetes, serious heart conditions, and hypertension among adults 45–64 years of age.
Studies of adult health have shown an association between income and health (1,2). The relationship between income and health problems reflects both the effect of income on health and the effect of poor health on the ability to work and earn a living. Poverty is associated with some modifiable risk factors for hypertension, diabetes, and heart disease. Obesity and inactivity are modifiable risk factors for diabetes, heart disease, and hypertension (3–5). Cigarette smoking is a modifiable risk factor for heart disease and high blood pressure. Poverty is associated with higher levels of inactivity (Table 71) and cigarette smoking (6) but not with obesity (Table 72). Poverty is also associated with factors that affect access to health care, such as being uninsured (Table 140) and delaying or not receiving needed medical care or prescription medications due to cost (Table 77).
Data from the National Health Interview Survey were used to assess the prevalence of diagnosed hypertension, diabetes, and serious heart conditions among noninstitutionalized adults 45–64 years of age—the time in life when the prevalence of these conditions begins to rise (6) (Tables 51 and 68). Prevalence estimates are based on respondent reports of ever being told by a physician or other health professional that they had the specified health condition. The prevalence of these conditions is underestimated because some persons may have the condition but have not been diagnosed yet. This is especially of concern for diabetes, which in the early stages is often asymptomatic and requires a blood test for diagnosis. However, data from the National Health and Nutrition Examination Survey, in which respondents report conditions and also undergo clinical examination and laboratory testing, indicate that undiagnosed diabetes was not more common among lower income persons (7).
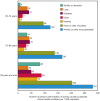
The prevalence of respondent-reported diagnosed hypertension, diabetes, and serious heart conditions was higher among poor adults 45–64 years of age than among their higher income counterparts. In 2007, poor adults in that age group were 56% more likely than those with family income more than twice the poverty level to have diagnosed hypertension and more than twice as likely to have diagnosed diabetes or diagnosed serious heart conditions (Figure 10).
The percentage of poor adults 45–64 years of age with hypertension was similar to the percentage of higher income persons who were 65–74 years of age (46%–48%; data table for Figure 10). Also, for diabetes, the estimates were similar for poor persons 45–64 years of age and higher-income persons 65–74 years of age (18%–19%; data table for Figure 10). By 65–74 years of age, the poverty differentials for the selected chronic conditions had narrowed, and among those 75 years of age and over had disappeared (data table for Figure 10).
References
- 1.
- Smith JP. Healthy bodies and thick wallets: The dual relation between health and economic status. J Econ Perspect. 1999;13(2):145–66. [PMC free article: PMC3697076] [PubMed: 15179962]
- 2.
- Wu S. The effects of health events on the economic status of married couples. J Hum Resour. 2003;38(1):219–30.
- 3.
- Medline Plus Encyclopedia. National Institutes of Heath, National Library of Medicine; 2009. Type 2 diabetes—Risk factors [online] Available from: http://www
.nlm.nih.gov /MEDLINEPLUS/ency/article/002072.htm. - 4.
- National Heart, Lung, and Blood Institute. In brief: Your guide to a healthy heart. NIH pub no 06–5715. Bethesda, MD: National Institutes of Health; 2006. Available from: http://www
.nhlbi.nih .gov/health/public/heart /other/your_guide/healthyheart_fs .pdf. - 5.
- National Heart, Lung, and Blood Institute. NIH pub no 04–5230. Bethesda, MD: National Institutes of Health; 2004. Seventh report of the Joint National Committee on Prevention, Detection, Evaluation, and Treatment of High Blood Pressure (JNC7). Available from: http://www
.nhlbi.nih .gov/guidelines/hypertension/ [PubMed: 20821851] - 6.
- Pleis JR, Lucas JW. Vital Health Stat. Hyattsville, MD: NCHS; 2009. Summary health statistics for U.S. adults: National Health Interview Survey, 2007. Available from: http://www
.cdc.gov/nchs /data/series/sr_10/sr10_240.pdf. [PubMed: 19645319] - 7.
- Zhang X, Geiss LS, Cheng YJ, Beckles GL, Gregg EW, Kahn HS. The missed patient with diabetes: How access to health care affects the detection of diabetes. Diabetes Care. 2008;31(9):1748–53. [PMC free article: PMC2518339] [PubMed: 18753665]
Occupational Health
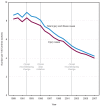
The rate of reported nonfatal occupational injuries and illnesses in private industries was cut in half between 1989 (8.6 cases per 100 full-time workers) and 2007 (4.2 cases).
Health and safety in the workplace have long been of concern. In 1912, the Bureau of Labor Statistics launched a survey of workplace conditions, studying industrial accidents in the iron and steel industry (1). The 1919 Conference on Industrial Hygiene was one of the first major attempts to examine the issues related to occupational health (2). Early efforts to improve the workplace were local and often industry-specific, such as regulations aimed at improving mining safety (2). Ongoing data collection of workplace injury data began in the 1930s, but efforts were hampered because reporting was voluntary. The modern era of occupational health and safety began in 1970 with the creation of the Occupational Safety and Health Administration (OSHA) and the National Institute for Occupational Safety and Health (NIOSH). OSHA is charged with promoting health and safety in the workplace by setting and enforcing standards. NIOSH is responsible for providing research, education, and training in the field of occupational safety and health (3).
OSHA regulations require that employers maintain records of occupational fatalities, injuries, and illnesses. The Bureau of Labor Statistics conducts the Survey of Occupational Injuries and Illnesses (SOII) to collect data on occupational injuries and illnesses from a sample of establishments. The SOII is a federal/state program that collects statistics that are used to identify problems with workplace safety and develop programs to improve workplace safety (see Appendix I, Survey of Occupational Injuries and Illnesses). Data include the number of new nonfatal injuries and illnesses in private industry, including those cases requiring days away from work (also see Table 46). OSHA instituted data collection changes in 1992, 1995, and 2002 aimed at improving data quality (4). These data collection changes may affect the comparability of the data over time. Therefore, caution is urged when interpreting trends. A recent House of Representatives report (5) reviewed the importance of accurate recordkeeping by employers, including evidence that injuries and illnesses are significantly underreported (6–8). The hearings included testimony on the reasons why injury and illness statistics may be underreported. See Technical Notes for more information.
The rate of reported nonfatal occupational injuries and illnesses in private industry was cut in half between 1989 (8.6 cases per 100 full-time workers) and 2007 (4.2 cases) (Figure 11). More than 95% of these cases are related to occupational injuries, such as a cuts, fractures, or sprains resulting from work-related events or exposures. The remaining cases are occupational illness cases, including acute and chronic illnesses or diseases caused by inhalation, absorption, ingestion, or direct contact associated with employment (3,4).
Data on fatal occupational injuries are collected separately from nonfatal injuries and illnesses (3) (see Appendix I, Census of Fatal Occupational Injuries). In 2007, 5,657 workers were killed on the job, for a rate of 3.8 deaths from injury per 100,000 employed workers (Table 45). This is a decrease from 4.9 deaths per 100,000 employed workers in 1995. The industries with the highest rates of fatal injuries in 2007 were agriculture, forestry, fishing, and hunting (27.9); mining (25.1); and transportation and warehousing (16.9).
References
- 1.
- Pollack ES, Keimig DG, editors. Counting injuries and illnesses in the workplace: Proposals for a better system . Washington, DC: National Academy Press; 1987.
- 2.
- Cullen MR. Personal reflections on occupational health in the twentieth century: Spiraling to the future. Annu Rev Public Health. 1999;20:1–13. [PubMed: 10352846]
- 3.
- National Institute for Occupational Safety and Health (NIOSH). DHHS (NIOSH) pub no 2004–146. Cincinnati, OH: NIOSH; 2004. Worker health chartbook, 2004. Available from: http://www
.cdc.gov/niosh /docs/2004-146/pdfs/2004-146.pdf. - 4.
- BLS handbook of methods [online] . U.S. Bureau of Labor Statistics; 2009. Available from: http://www
.bls.gov/opub/hom/ - 5.
- Hidden tragedy: Underreporting of workplace injuries and illnesses. A majority staff report by the House Comm on Education and Labor; 110th Cong; June 2008; Available from: http://edlabor
.house .gov/publications/20080619WorkplaceInjuriesReport.pdf. - 6.
- Hidden tragedy: Underreporting of workplace injuries and illnesses. Hearings before the House Comm on Education and Labor; 110th Cong; June 2008; Available from: http://edlabor
.house .gov/hearings/2008/06/ - 7.
- Rosenman KD, Kalush A, Reilly MJ, Gardiner JC, Reeves M, Luo Z. How much work-related injury and illness is missed by the current national surveillance system? J Occup Environ Med. 2006;48(4):357–65. [PubMed: 16607189]
- 8.
- Boden LI, Ozonoff A. Capture-recapture estimates of nonfatal workplace injuries and illnesses. Ann Epidemiol. 2008;18(6):500–6. [PubMed: 18083542]
Depression
In 2005–2006, women (6.6%) were about 50% more likely to have current depression than men (4.4%).
Depression is a common condition that has been described as one of the world’s most burdensome (1,2). Depression is typified by difficulties with mood, sleep, feelings of self-worth, and concentration and energy levels (3). Depression is associated with increased morbidity and mortality, reduced productivity, and poorer quality of life (4–8). Major depression may be incapacitating (6,8). The introduction of a new class of antidepressant drugs—selective serotonin reuptake inhibitors (SSRIs)—represented a major technological advance in the treatment of this condition (9) (Figure 23), yet depression remains underdiagnosed and inadequately treated (1,6,10).
Depression is measured through a self-reported assessment based on a series of questions in the National Health and Nutrition Examination Survey 2005–2006 component. The Patient Health Questionnaire (PHQ) included nine questions on the signs and symptoms of depression experienced by respondents in the 2 weeks prior to interview. Respondents indicated how frequently they felt down, had trouble sleeping, had little energy, felt bad about themselves, and other symptoms. Responses were scored based on the frequency of these symptoms, from “not at all” (0) to “nearly every day” (3). A score of 10 or higher (out of a possible total score of 27) was classified as depression in this analysis (11,12). For more information on the measure of depression used in this analysis, see Technical Notes.
In 2005–2006, 5.5% of adults 18 years of age and over were classified as having depression, based on symptoms over the prior 2 weeks. Women were about 50% more likely to have current depression than men (Figure 12). In 2005–2006, 6.6% of women and 4.4% of men were classified as having depression. Depression was significantly more common among those 40–59 years of age (7.3%) than among younger adults 18–39 years of age (4.7%) and older adults 60 years of age and over (4.0%).
References
- 1.
- Timonen M, Liukkonen T. Management of depression in adults. BMJ. 2008;336(7641):435–9. [PMC free article: PMC2249627] [PubMed: 18292169]
- 2.
- Kessler RC, Berglund P, Demler O, Jin R, Koretz D, Merikangas KR, et al. The epidemiology of major depressive disorder: Results from the National Comorbidity Survey Replication (NCS–R). JAMA. 2003;289:3095–105. [PubMed: 12813115]
- 3.
- Depression [online] . World Health Organization; 2009. Available from: http://www
.who.int/mental_health /management /depression/definition/en/ - 4.
- Wells KB, Stewart A, Hays RD, Burnam MA, Rogers W, Daniels M, et al. The functioning and well-being of depressed patients: Results from the Medical Outcomes Study. JAMA. 1989;262(7):914–9. [PubMed: 2754791]
- 5.
- Cuijpers P, Smit F. Excess mortality in depression: A meta-analysis of community studies. J Affect Disord. 2002;72(7641):227–36. [PubMed: 12450639]
- 6.
- Ebmeier KP, Donaghey C, Steele JD. Recent developments and current controversies in depression. Lancet. 2006;367(9505):153–67. [PubMed: 16413879]
- 7.
- Stewart WF, Ricci JA, Chee E, Hahn SR, Morganstein D. Cost of lost productive work time among US workers with depression. JAMA. 2003;289:3135–44. [PubMed: 12813119]
- 8.
- Keller MB. Past, present, and future directions for defining optimal treatment outcome in depression: Remission and beyond. JAMA. 2003;289:3152–60. [PubMed: 12813121]
- 9.
- Cutler DM, McClellan M. Is technological change in medicine worth it? Health Aff (Millwood). 2001;20(5):11–29. [PubMed: 11558696]
- 10.
- Wang PS, Lane M, Olfson M, Pincus HA, Wells KB, Kessler RC. Twelve-month use of mental health services in the United States: Results from the National Comorbidity Survey Replication. Arch Gen Psychiatry. 2005;62(6):629–40. [PubMed: 15939840]
- 11.
- Pratt LA, Brody DJ. NCHS data brief. Hyattsville, MD: NCHS; 2008. Depression in the United States household population, 2005–2006. Available from: http://www
.cdc.gov/nchs /data/databriefs/db07.htm. [PubMed: 19389321] - 12.
- Kroenke K, Spitzer RL, Williams JB. The PHQ–9: Validity of a brief depression severity measure. J Gen Intern Med. 2001;16(9):606–13. [PMC free article: PMC1495268] [PubMed: 11556941]
Limitation of Activity Caused by Chronic Conditions: Children
Conditions associated with learning, emotional, behavioral, and developmental problems are among the leading causes of activity limitation among children.
Limitation of activity due to chronic physical, mental, or emotional conditions is a broad measure of health and functioning that gauges a child’s ability to engage in major age-appropriate activities. This measure of health is also related to a child’s need for special educational and medical services. The National Health Interview Survey identifies children with activity limitation through questions about specific limitations in activities such as play, self-care, walking, memory, and other activities, and the current use of special education or early intervention services. Estimates of the number of children with an activity limitation may differ depending on the type of limitations included and the methods used to identify them (1).
Between 1997 and 2007, the percentage of children with activity limitation was 7% (2). In 2006–2007, the percentage of younger (8%) and older (9%) school-age children with activity limitation was double the percentage of preschoolers with activity limitation (4%) (3). Most school-age children with activity limitation were identified as limited solely by their participation in special education (4).
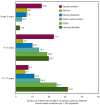
In 2006–2007, chronic health conditions causing activity limitation in children varied by age (Figure 13). A speech problem, mental retardation, and asthma were identified by parents as the leading causes of activity limitation among preschool children. Learning disability and attention-deficit/hyperactivity disorder (ADHD or ADD) were mentioned as important causes of activity limitation among all school-age children. Among younger school-age children (5–11 years of age), a speech problem was also reported as an important condition causing activity limitation. Among older school-age children (12–17 years), a mental, emotional, or behavioral problem (other than ADHD or mental retardation or another developmental problem) was reported as an important condition causing activity limitation.
References
- 1.
- Newacheck PW, Strickland B, Shonkoff JP, Perrin JM, McPherson M, McManus M, et al. An epidemiologic profile of children with special health care needs. Pediatrics. 1998;102(1):117–23. [PubMed: 9651423]
- 2.
- NCHS. Health United States, 2008: With special feature on the health of young adults, Table 58. Hyattsville, MD: NCHS; 2009. [PubMed: 20698069]
- 3.
- NCHS. National Health Interview Survey, unpublished analysis.
- 4.
- America’s children: Key national indicators of well-being. Washington, DC: U.S. Government Printing Office; 2007. 2007. Federal Interagency Forum on Child and Family Statistics. Available from: http://www
.childstats.gov/
Limitation of Activity Caused by Chronic Conditions: Working-age and Older Adults
Arthritis and other musculoskeletal conditions are the most frequently reported cause of activity limitation among both working-age and older adults.
Chronic physical, mental, and emotional conditions can limit the ability of adults to perform important activities such as working and doing everyday household chores. With advancing age, an increasing percentage of adults experience limitation of activity. Estimates of the number of working-age and older adults with limitation of activity are important for determining current and future health care needs and associated costs (1,2).
Between 1997 and 2007, the percentage of noninstitutionalized working-age adults 18–64 years of age reporting an activity limitation caused by a chronic health condition remained relatively stable at 10% (3). In 2006–2007, the percentage of working-age adults who reported limitations ranged from 6% at age 18–44 years to 20% at age 55–64 years (3). Arthritis and other musculoskeletal conditions were the most frequently mentioned conditions causing limitation among working-age adults of all ages in 2006–2007 (Figure 14). Among adults 18–44 years of age, mental illness was the second leading cause of activity limitation. Among adults 45–64 years of age, heart and circulatory conditions were the second leading cause of limitation, and mental illness was another frequently mentioned condition.
The percentage of noninstitutionalized adults 65 years of age and over with limitation of activity decreased from 39% to 36% between 1997 and 1999 and then remained at 34%–35% between 2000 and 2007 (3). In 2006–2007, the percentage of older adults with limitation of activity increased from 26% of 65–74 year olds, to 36% of 75–84 year olds, and to 62% of adults 85 years old and over (3). Arthritis and other musculoskeletal conditions were the most frequently mentioned chronic conditions causing limitation of activity (Figure 15). Heart and circulatory conditions were the second leading cause of activity limitation. Among noninstitutionalized adults 85 years and over, senility or dementia, vision conditions, and hearing problems were frequently mentioned causes of activity limitation.
References
- 1.
- Kramarow E, Lubitz J, Lentzner H, Gorina Y. Trends in the health of older Americans, 1970–2005. Health Aff (Millwood). 2007;26(5):1417–25. [PubMed: 17848453]
- 2.
- Hootman JM, Brault MW, Helmick CG, Theis KA, Armour BS. Prevalence and most common causes of disability among adults—United States, 2005. MMWR. 2009;58(16):421–6. [PubMed: 19407734]
- 3.
- NCHS. National Health Interview Survey, unpublished analysis.
- Morbidity and Limitation of Activity - Health, United States, 2009Morbidity and Limitation of Activity - Health, United States, 2009
Your browsing activity is empty.
Activity recording is turned off.
See more...
