

NCBI Bookshelf. A service of the National Library of Medicine, National Institutes of Health.
Healthcare Cost and Utilization Project (HCUP) Statistical Briefs [Internet]. Rockville (MD): Agency for Healthcare Research and Quality (US); 2006 Feb-.
Introduction
More than 25 years after the U.S. Surgeon General officially recognized violence as a public health priority, violence continues to have significant consequences in the community.1 Homicide and suicide continue to be leading causes of mortality for all ages.2 Yet, violent deaths are only a part of this public health burden. High medical costs, disability, and lost productivity occur when many more individuals survive violence. These men, women, and children are often treated in emergency departments (ED) or admitted to hospitals for serious physical and emotional trauma.
This Statistical Brief presents data from the Healthcare Cost and Utilization Project (HCUP) on violence-related stays in U.S. community hospitals in 2005. Based on the classification schema used by the Center for Disease Control and Prevention’s (CDC) National Center for Health Statistics (NCHS), we have distinguished between hospitalizations resulting from self-inflicted violence and those resulting from violence against someone else.2 Self-inflicted violence includes any deliberate violent behavior directed at oneself with or without suicidal intent. Violence against someone else includes violent behavior conducted by an unknown perpetrator (assault) and acts of abuse and neglect conducted by a caregiver or intimate partner (maltreatment). Utilization and resource use for violence-related hospitalizations, including specific acts of violence such as self-inflicted, assault, and maltreatment, are compared to stays unrelated to violence.3 Patient and payer characteristics of violence-related hospitalizations are also described. Finally, the most common principal diagnoses among violence-related hospitalizations are identified for specific types of violence. All differences between estimates noted in the text are statistically significant at the 0.05 level or better.
Findings
Highlights
- In 2005, there were an estimated 308,200 violence-related hospitalizations in the U.S., totaling $2.3 billion in hospital costs.
- Nearly two-thirds of violence-related stays (65.8 percent) resulted from self-inflicted acts, while 30.8 percent were the result of assaults. Maltreatment was noted in 4.2 percent of all violence-related hospitalizations.
- The in-hospital death rate among stays associated with maltreatment was 23 percent higher than the in-hospital death rate for stays unrelated to violence (2.9 percent versus 2.3 percent).
- Males accounted for 82.4 percent of stays resulting from assaults, while females accounted for the majority of hospitalizations related to maltreatment (63.9 percent) and self-inflicted violence (58.5 percent).
- Young adults 18 to 44 years old made up 62.0 percent of stays associated with self-inflicted violence and 68.3 percent of assault-related stays. More than half (52.2 percent) of all hospitalizations related to maltreatment occurred among children.
- Compared to only 16.7 percent of stays unrelated to violence, 27.0 percent of violence-related stays were billed to Medicaid. Uninsured patients accounted for 22.6 percent of violence-related stays—more than four times the proportion of uninsured stays not associated with violence (5.3 percent).
In 2005, there were an estimated 308,200 hospitalizations associated with violence. These stays represented 0.9 percent of all non-birth related stays in U.S. community hospitals. Nearly two out of three violence-related stays (65.8 percent) resulted from self-inflicted acts, while almost one-third (30.8 percent) were the result of assaults. Suspected or confirmed maltreatment was noted in 4.2 percent of all violence-related hospitalizations. However, the actual number of hospitalizations related to violence may be underestimated due to stigma or fear associated with reporting such incidents on the hospital record.
General characteristics of hospital stays related to violence
Table 1 describes the hospital utilization and costs associated with violence-related stays, as compared to stays unrelated to violence. In 2005, the hospital costs associated with violence-related stays totaled $2.3 billion. Hospitalizations associated with violence were, on average, less costly than stays unrelated to violence ($7,600 versus $8,800). While the average cost of stays related to self-inflicted violence was $5,500, the hospital costs associated with assault and maltreatment were significantly higher, averaging $11,800 and $11,200, respectively.
Table 1
Violence-related hospitalizations compared to all other hospitalizations, 2005.
Although stays associated with any violence were, on average, nearly half a day shorter than stays unrelated to violence (4.3 days versus 4.8 days), stays related to maltreatment resulted in hospitalizations that were almost two days longer (6.6 days). Stays resulting from self-inflicted violence averaged 3.9 days—one day shorter than stays for injuries sustained from assault by another person (4.9 days).
Compared to hospitalizations unrelated to violence, the rate of in-hospital deaths was 37 percent lower for stays associated with violence (1.5 percent versus 2.3 percent). In fact, the in-hospital death rate for self-inflicted violence (1.2 percent) was almost half that for stays unrelated to violence.4 Hospitalizations associated with assaults had an in-hospital death rate of 1.9 percent. Conversely, the rate of in-hospital deaths among patients admitted for trauma sustained as a result of maltreatment was 23 percent higher than the in-hospital death rate for stays unrelated to violence (2.9 percent versus 2.3 percent).
Hospital stays related to violence, by gender and age
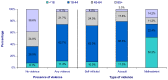
Compared to hospitalizations unrelated to violence, violence-related stays occurred disproportionately among males (39.8 percent versus 54.2 percent) (figure 1). While males accounted for 82.4 percent of stays resulting from assaults, females accounted for the majority of hospitalizations related to maltreatment (63.9 percent) and self-inflicted violence (58.5 percent).5

Figure 2 illustrates that young adults and children were disproportionately hospitalized for violent traumas. Nearly three out of every four (74.1 percent) violence-related hospitalizations occurred among patients younger than 45 years old, as compared to 36.6 percent of hospitalizations not associated with violence. Young adults 18 to 44 years old made up the vast majority of stays associated with self-inflicted violence (62.0 percent) and assaults (68.3 percent). More than half (52.2 percent) of all hospitalizations related to maltreatment occurred among children younger than 18 years old. Elderly patients over 65 years old accounted for an additional 14.2 percent of stays associated with maltreatment.
Hospital stays related to violence, by primary payer
Reflecting the findings that a higher proportion of children and young adults are hospitalized as a result of violence, figure 3 shows that violence-related hospitalizations occurred disproportionately among patients covered by Medicaid and those who are uninsured. Compared to only 16.7 percent of stays unrelated to violence, 27.0 percent of violence-related stays were billed to Medicaid. Moreover, more than half (51.0 percent) of stays associated with maltreatment were billed to Medicaid. Similarly, the proportion of uninsured violence-related hospitalizations was more than four times the proportion of uninsured stays among hospitalizations unrelated to violence (22.6 percent versus 5.3 percent). In fact, uninsured patients accounted for 31.6 percent of stays associated with assaults—nearly six times the proportion of uninsured stays unrelated to violence.
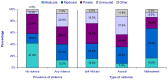
Violence-related hospital stays were billed to Medicare and private insurance less frequently than hospitalizations not associated with violence. Medicare was billed for only 13.2 percent of violence-related stays—about one-third the rate of stays not associated with violence (41.9 percent). Medicare was billed for even fewer assault-related hospitalizations (7.4 percent). Conversely, the percentage of privately insured violence-related hospitalizations was only slightly lower than the percentage of privately insured stays unrelated to violence (30.0 percent versus 33.1 percent). However, privately insured patients comprised a significantly smaller percentage of stays associated with assault (21.1 percent) and maltreatment (18.9 percent).
Common principal diagnoses noted on hospital stays related to violence
With the exception of codes indicating maltreatment, codes indicating violence are reported as secondary diagnoses; thus, other conditions are primarily responsible for the patient’s admission to the hospital. Table 2 lists the most frequent principal diagnoses among stays related to self-inflicted violence, assault, and maltreatment. Among stays related to self-inflicted violence, over half were principally diagnosed with poisonings by medications and drugs (32.4 percent) or by psychotropic agents (23.8 percent). One in five stays related to self-inflicted violence had mood disorders (22.1 percent) as the principal reason for admission. Schizophrenia and substance-related disorders were also noted as principal causes of admission in these stays (3.2 percent and 2.6 percent, respectively).
Table 2
Top five principal diagnoses associated with violence-related hospitalizations, 2005.
For assault-related stays, nearly half of all hospitalizations were principally for serious physical injuries such as crushing or internal injuries (19.2 percent), skull and facial fractures (15.8 percent), and intracranial injuries (13.0 percent). Other injuries sustained during assaults and commonly noted as the principal diagnosis were open wounds of the head, neck, and trunk (9.8 percent) and open wounds of the extremities (5.4 percent).
Among stays associated with maltreatment, 33.3 percent noted other injuries and conditions due to external causes as the principal reason for admission. Among these other injuries and conditions were child physical abuse (49.8 percent), shaken infant syndrome (14.5 percent), and adult maltreatment syndrome (10.8 percent) (data not shown). Mood disorder was listed as the principal diagnosis for 5.4 percent of maltreatment-related hospitalizations. Intracranial injuries (5.0 percent), other complications of pregnancy (3.4 percent), and skull and face fractures (2.5 percent) were also among the top five principal diagnoses recorded for these stays.
Data Source
The estimates in this Statistical Brief are based upon data from the HCUP 2005 Nationwide Inpatient Sample (NIS).
Definitions
Diagnoses, ICD-9-CM, E-codes, and Clinical Classifications Software (CCS)
The principal diagnosis is that condition established after study to be chiefly responsible for the patient’s admission to the hospital. Secondary diagnoses are concomitant conditions that coexist at the time of admission or that develop during the stay.
ICD-9-CM is the International Classification of Diseases, Ninth Revision, Clinical Modification, which assigns numeric codes to diagnoses. There are about 12,000 ICD-9-CM diagnosis codes.
The External Cause of Injury Codes (commonly referred to as E-codes) supplement the ICD-9-CM diagnosis codes. These codes designate the cause of injury. Multiple E-codes may be present on a single hospital record.
CCS categorizes ICD-9-CM diagnoses into 260 clinically meaningful categories.6 This “clinical grouper” makes it easier to quickly understand patterns of diagnoses and procedures.
Case Definition
The ICD-9-CM codes defining violence include diagnoses and E-codes in the following range: 995.80–995.85, 995.50–995.59, V71.81, E967-E967.9, E960-E966, E968-E969, V71.5, V71.6, E950-E959, V62.84, E970-E978, E979.0-E979.9, E990-E999. It is important to note that these codes may be underutilized if there is stigma or fear associated with reporting violent behavior on the hospital record.
For this report, specific types of violence were defined as diagnoses and E-codes:
Self-inflicted
- –
E950.0-E959: Suicide and attempted suicide; self-inflicted injuries specified as intentional
- –
V62.84: Suicidal ideation
Assault
- –
E960.0-E966: Fight, brawl, rape; homicides and assaults using dangerous substances, firearms, explosives, cutting and piercing instruments
- –
E968.0-E968.3, E968.5-E969: Assault by fire and other unspecified means; late effects of injury purposely inflicted by others
- –
V71.5: Observation following alleged rape or seduction
- –
V71.6: Observation following other inflicted injury
Maltreatment
- –
995.5–995.59: Child maltreatment syndrome
- –
995.80–995.85: Adult maltreatment, unspecified; adult physical abuse; adult emotional/psychological abuse; adult sexual abuse; adult neglect (nutritional); other adult abuse and neglect
- –
V71.81: Observation and evaluation for abuse and neglect
- –
E967.0-E967.9: Child and battering/maltreatment; perpetrator codes
- –
E968.4: Criminal neglect
Types of hospitals included in HCUP
HCUP is based on data from community hospitals, defined as short-term, non-Federal, general and other hospitals, excluding hospital units of other institutions (e.g., prisons). HCUP data include OB-GYN, ENT, orthopedic, cancer, pediatric, public, and academic medical hospitals. They exclude long-term care, rehabilitation, psychiatric, and alcoholism and chemical dependency hospitals, but these types of discharges are included if they are from community hospitals.
Unit of analysis
The unit of analysis is the hospital discharge (i.e., the hospital stay), not a person or patient. This means that a person who is admitted to the hospital multiple times in one year will be counted each time as a separate “discharge” from the hospital.
Costs and charges
Total hospital charges were converted to costs using HCUP Cost-to-Charge Ratios based on hospital accounting reports from the Centers for Medicare and Medicaid Services (CMS).7 Costs will tend to reflect the actual costs of production, while charges represent what the hospital billed for the case. For each hospital, a hospital-wide cost-to-charge ratio is used because detailed charges are not available across all HCUP States. Hospital charges reflect the amount the hospital charged for the entire hospital stay and does not include professional (physician) fees. For the purposes of this Statistical Brief, costs are reported to the nearest hundred.
Payer
Payer is the expected primary payer for the hospital stay. To make coding uniform across all HCUP data sources, payer combines detailed categories into more general groups:
- –
Medicare includes fee-for-service and managed care Medicare patients.
- –
Medicaid includes fee-for-service and managed care Medicaid patients. Patients covered by the State Children’s Health Insurance Program (SCHIP) may be included here. Because most state data do not identify SCHIP patients specifically, it is not possible to present this information separately.
- –
Private insurance includes Blue Cross, commercial carriers, and private HMOs and PPOs.
- –
Other includes Worker’s Compensation, TRICARE/CHAMPUS, CHAMPVA, Title V, and other government programs.
- –
Uninsured includes an insurance status of “self-pay” and “no charge.”
When more than one payer is listed for a hospital discharge, the first-listed payer is used.
Admission source
Admission source indicates where the patient was located prior to admission to the hospital. Emergency admission indicates the patient was admitted to the hospital through the emergency department.
Discharge status
Discharge status indicates the disposition of the patient at discharge from the hospital, and includes the following six categories: routine (to home), transfer to another short-term hospital, other transfers (including skilled nursing facility, intermediate care, and another type of facility such as a nursing home), home health care, against medical advice (AMA), or died in the hospital.
For More Information
For more information about HCUP, visit www.hcup-us.ahrq.gov.
For additional HCUP statistics, visit HCUPnet, our interactive query system, at www.hcup.ahrq.gov.
For information on other hospitalizations in the U.S., download HCUP Facts and Figures: Statistics on Hospital-based Care in the United States in 2005, located at http://www.hcup-us.ahrq.gov/reports.jsp.
For a detailed description of HCUP, more information on the design of the NIS, and methods to calculate estimates, please refer to the following publications:
Steiner, C., Elixhauser, A., Schnaier, J. The Healthcare Cost and Utilization Project: An Overview. Effective Clinical Practice 5(3):143–51, 2002.
Design of the HCUP Nationwide Inpatient Sample, 2005. Online. June 13, 2007. U.S. Agency for Healthcare Research and Quality. http://www.hcup-us.ahrq.gov/db/nation/nis/reports/NIS_2005_Design_Report.pdf
Houchens, R., Elixhauser, A. Final Report on Calculating Nationwide Inpatient Sample (NIS) Variances, 2001. HCUP Methods Series Report #2003-2. Online. June 2005 (revised June 6, 2005). U.S. Agency for Healthcare Research and Quality. http://www.hcup-us.ahrq.gov/reports/CalculatingNISVariances200106092005.pdf
Footnotes
- 1
Healthy People: The Surgeon General’s Report on Health Promotion and Disease Prevention. Washington, DC, United States Department of Health, Education, and Welfare, Public Health Service, Office of the Assistant Secretary for Health and Surgeon General, 1979 (publication 79–55071).
- 2
Centers for Disease Control and Prevention (CDC). Web-based Injury Statistics Query and Reporting System (WISQARS) [Online]. National Center for Injury Prevention and Control, CDC. 2005. www
.cdc.gov/ncipc/wisqars/default.htm. - 3
Newborn records were excluded from this analysis.
- 4
This is consistent with research by Goldsmith et al. (2002) indicating that the overwhelming majority of suicide attempts are unsuccessful and most successful suicides are never admitted to the hospital.
- 5
The higher proportion of hospital stays associated with self-inflicted violence among females is likely explained by the common usage of poisons by women to commit suicide (CDC WISQARS, 2005) and the higher number of unsuccessful suicide attempts by women (World Health Organization, 2002).
- 6
HCUP CCS. Healthcare Cost and Utilization Project (HCUP). August 2006. U.S. Agency for Healthcare Research and Quality, Rockville, MD. www
.hcup-us.ahrq.gov /toolssoftware/ccs/ccs.jsp - 7
HCUP Cost-to-Charge Ratio Files (CCR). Healthcare Cost and Utilization Project (HCUP). 2001–2003. U.S. Agency for Healthcare Research and Quality, Rockville, MD. www
.hcup-us.ahrq.gov /db/state/costtocharge.jsp.
About the NIS: The HCUP Nationwide Inpatient Sample (NIS) is a nationwide database of hospital inpatient stays. The NIS is nationally representative of all community hospitals (i.e., short-term, non-Federal, non-rehabilitation hospitals). The NIS is a sample of hospitals and includes all patients from each hospital, regardless of payer. It is drawn from a sampling frame that contains hospitals comprising 88 percent of all discharges in the United States. The vast size of the NIS allows the study of topics at both the national and regional levels for specific subgroups of patients. In addition, NIS data are standardized across years to facilitate ease of use.
About HCUPnet: HCUPnet is an online query system that offers instant access to the largest set of all-payer health care databases that are publicly available. HCUPnet has an easy step-by-step query system, allowing for tables and graphs to be generated on national and regional statistics, as well as trends for community hospitals in the U.S. HCUPnet generates statistics using data from HCUP’s Nationwide Inpatient Sample (NIS), the Kids’ Inpatient Database (KID), the State Inpatient Databases (SID) and the State Emergency Department Databases (SEDD).
Suggested Citation: Russo, C.A. (Thomson Healthcare), Owens, P.L. (AHRQ), and Hambrick, M.M. (AHRQ). Violence-Related Stays in U.S. Hospitals, 2005. HCUP Statistical Brief #48. March 2008. Agency for Healthcare Research and Quality, Rockville, MD. http://www
.hcup-us.ahrq .gov/reports/statbriefs/sb48.pdf
- Review Hospital Stays Related to Child Maltreatment, 2005.[Healthcare Cost and Utilizatio...]Review Hospital Stays Related to Child Maltreatment, 2005.Russo CA, Hambrick MM, Owens PL. Healthcare Cost and Utilization Project (HCUP) Statistical Briefs. 2006 Feb
- Review Tuberculosis Stays in U.S. Hospitals, 2006.[Healthcare Cost and Utilizatio...]Review Tuberculosis Stays in U.S. Hospitals, 2006.Holmquist L, Russo CA, Elixhauser A. Healthcare Cost and Utilization Project (HCUP) Statistical Briefs. 2006 Feb
- Surveillance for Violent Deaths - National Violent Death Reporting System, 27 States, 2015.[MMWR Surveill Summ. 2018]Surveillance for Violent Deaths - National Violent Death Reporting System, 27 States, 2015.Jack SPD, Petrosky E, Lyons BH, Blair JM, Ertl AM, Sheats KJ, Betz CJ. MMWR Surveill Summ. 2018 Sep 28; 67(11):1-32. Epub 2018 Sep 28.
- Review Hospitalizations for Brain Cancer, 2006.[Healthcare Cost and Utilizatio...]Review Hospitalizations for Brain Cancer, 2006.Holmquist L, Russo CA, Elixhauser A. Healthcare Cost and Utilization Project (HCUP) Statistical Briefs. 2006 Feb
- Review Most Frequent Principal Diagnoses for Inpatient Stays in U.S. Hospitals, 2018.[Healthcare Cost and Utilizatio...]Review Most Frequent Principal Diagnoses for Inpatient Stays in U.S. Hospitals, 2018.McDermott KW, Roemer M. Healthcare Cost and Utilization Project (HCUP) Statistical Briefs. 2006 Feb
- Violence-Related Stays in U.S. Hospitals, 2005 - Healthcare Cost and Utilization...Violence-Related Stays in U.S. Hospitals, 2005 - Healthcare Cost and Utilization Project (HCUP) Statistical Briefs
Your browsing activity is empty.
Activity recording is turned off.
See more...