

NCBI Bookshelf. A service of the National Library of Medicine, National Institutes of Health.
Mulrow CD, Williams JW Jr, Trivedi M, et al. Treatment of Depression: Newer Pharmacotherapies. Rockville (MD): Agency for Health Care Policy and Research (US); 1999 Feb. (Evidence Reports/Technology Assessments, No. 7.)
This publication is provided for historical reference only and the information may be out of date.
Questions Addressed in the Evidence Report
Questions to be addressed were developed and refined by the San Antonio Evidence-based
Practice Center together with the technical panel of experts. This multidisciplinary group
included representatives from our partner organizations (American College of Physicians, South
Carolina Center for Health Care Research, Veterans Health Administration), organizations
nominating the topic (American Psychiatric Association, National Institutes of Mental Health),
mental health advocates (National Depressive and Manic Depressive Association), and other
organizations with a vital interest in the care of depressed patients (American Psychological
Association, American Academy of Family Physicians, a consortium of health maintenance
organizations, American Pharmaceutical Association, American Psychiatric Nurses' Association,
and Cochrane Collaboration Depression, Anxiety, and Neurosis Review Group). Question
development was guided by two key principles: potential to summarize new information not
reviewed in prior literature syntheses, and relevance to policymakers' developing guidelines
and clinicians' making treatment decisions. Twenty-four high priority questions were identified
by a modified Delphi process using e-mail correspondence and teleconference. They were:
- 1.
Are newer antidepressant agents more effective than placebo or older antidepressant agents for treating adult patients with major depression?
- 2.
Are newer antidepressant agents more effective than placebo or older antidepressant agents for treating adult patients with dysthymia?
- 3.
Are newer antidepressant agents more effective than placebo or older antidepressant agents for treating adult persons with mixed anxiety depression?
- 4.
Are newer antidepressant agents more effective than placebo or older antidepressant agents for treating adult patients with subsyndromal depressive disorders?
- 5.
Are newer antidepressant agents more effective than placebo or older antidepressant agents in the treatment of recurrent depression?
- 6.
Are newer antidepressant agents more effective than older agents in the treatment of adult patients with refractory depression?
- 7.
Are newer antidepressive agents more effective than psychosocial therapies for treating depressive disorders in adults?
- 8.
Is hypericum (St. John's wort) more effective than placebo or standard antidepressant agents for treating adult patients with depressive disorders?
- 9.
Are valeriana and kava kava more effective than placebo or standard antidepressants for treating depressive disorders in adults?
- 10.
Are newer antidepressant agents more effective than placebo or older antidepressants for treating depressive disorders in children and adolescents?
- 11.
Are newer antidepressant agents more effective than placebo or older antidepressants for treating older persons with depressive disorders?
- 12.
Are newer antidepressant agents more effective than placebo or older antidepressants for treating patients with comorbid medical (e.g., ischemic heart disease, cancer) or psychiatric (e.g., alcoholism) illness?
- 13.
Does the efficacy of newer agents vary between men and women and between different ethnic groups?
- 14.
Are newer antidepressant agents more effective than placebo or older antidepressant agents for treating adult primary care patients with depressive disorders?
- 15.
Are newer antidepressant agents more effective than placebo or older antidepressants in the postpartum setting?
- 16.
Are combinations of newer antidepressants with other antidepressants more efficacious than a single antidepressant for treating major depressive disorder in adults?
- 17.
Are combinations of newer antidepressants with other antidepressants or anxiolytics more effective than a single antidepressant for specific disorders (e.g., mixed anxiety depression) and symptoms (e.g., insomnia)?
- 18.
Is the combination of newer antidepressant agents with psychosocial therapies better than newer antidepressants alone for treating or maintaining remission for depressive disorders in adults?
- 19.
Are newer pharmacotherapies plus augmenting agents (e.g., lithium, pindolol) more effective than pharmacotherapy alone for treating adults with depressive disorders?
- 20.
Are newer antidepressant agents more effective than placebo, older agents, or psychosocial therapies for maintaining remission in adults with depressive disorders?
- 21.
What common adverse effects of newer antidepressant agents have been identified in randomized controlled trials and does their frequency vary significantly from one agent to another?
- 22.
Do trials show varying adherence rates among newer antidepressant agents and between newer agents and older ones?
- 23.
Do trials show varying rates between total dropouts, dropouts for adverse events, and dropouts for lack of efficacy?
- 24.
What uncommon but serious adverse effects of newer agents have been reported, and what is their frequency?
"Newer" and "Older" Pharmacotherapies
Efficacy in treating major depression has been well established for multiple "older" antidepressants, including first and second generation tricyclics, heterocyclics, and monoamine oxidase inhibitors. 6 During the last decade, several "newer" agents have surfaced. These include: selective serotonin reuptake inhibitors (SSRIs), serotonin noradrenaline reuptake inhibitors (SNRIs), norepinephrine reuptake inhibitors (NRIs), reversible inhibitors of monoamine oxidase (RIMAs), 5-HT2 receptor antagonists (5-HT2), 5-HT1A receptor agonists (5-HT1A), gabamimetics (Gaba), dopamine reuptake inhibitors (DopRIs) and antagonists (DopAnts), and herbal remedies such as hypericum (St. John's wort).
This report addresses the efficacy of "newer" agents compared with that of placebo, "older" agents, and psychosocial therapies. Table 1 lists mechanisms and usual doses of specific "newer" agents that are considered in the report. Table 2 lists "older" agents that have been compared with "newer" agents in randomized controlled trials.
Table
Table 1. "Newer" antidepressants by classification 32, 33, 34.
Table
Table 2. "Older" antidepressants by classification.
Literature Search and Selection Methods
Sources
English and non-English literature sources were: (1) The Cochrane Collaboration Depression, Anxiety, and Neurosis (CCDAN) Review Group's specialized registry of 8,451 clinical trial articles; (2) references from trial articles and 46 pertinent meta-analyses;6, 7, 22, 28, 30, 35-77 and (3) experts. The CCDAN specialized registry includes trials relevant to treatment of depression that are identified from multiple sources. They include electronic databases such as MEDLINE, EMBASE, PsycLIT, LILACS, Psyndex, SIGLE, CINAHL, Biological Abstracts, and The Cochrane Library (Appendix 1.1); handsearches of conference proceedings and 69 psychiatry-related journals (Appendix 1.2); contacts with 30 pharmaceutical companies (Appendix 1.3); and routine reference checking of trial articles and systematic reviews. All records in the CCDAN database have subject headings applied based on the National Library of Medicine's MeSH terms.
Pertinent meta-analyses were identified from MEDLINE using Hunt and McKibbon's search strategy. 78 Technical experts on the advisory panel were asked to identify additional trials.
Search Methods
Sources were searched from 1980 to January 1998 to capture literature relevant to newly released antidepressants not fully addressed by the first AHCPR Depression Guideline Panel report. 6 The subject terms "depression," "depressive disorder," or "dysthymic disorder" were combined with the list of "newer" antidepressants presented in Table 3 that were agreed on by the technical experts.
Table
Table 3. List of newer antidepressants used in literature search.
The search yielded 1,277 records, 97 percent of which were identified from the CCDAN registry. Thirty trials were identified from references of meta-analyses. One additional trial was identified by experts. (Of note, continuing searches of MEDLINE and PubMed were conducted from January 1998 through August 1998 while this report was being prepared and peer reviewed. Twenty-three additional trials were found; pertinent additional trials identified through recent ongoing searching are noted in each section.)
Selection Processes
Records were screened using inclusion criteria shown in Figure 1. Studies exclusively in special populations such as older adults, adolescents, or persons with comorbid medical conditions such as stroke, ischemic heart disease, or cancer were included. Studies in populations with concomitant psychological disorders such as alcoholism and anxiety were included with the exception of appetite disorders and schizophrenia, which were excluded. Studies in multiple settings including primary care, psychiatric, postpartum outpatients, and inpatients were included. A broad spectrum of depressive disorders such as major and subsyndromal depression, dysthymia, refractory and recurrent depression, and mixed anxiety-depressive disorder were included. Studies that looked at combinations of newer antidepressants with either another antidepressant or an augmenting drug were included. Studies that compared multiple doses of a single agent and had no other comparison groups were excluded. The first parallel period of crossover studies was included if it was at least 6 weeks in duration; study results collected after a crossover were excluded. All types of clinical outcomes were accepted including a variety of self- and interviewer-assessed depressive measures (e.g., Hamilton Depression Rating Scale [HAMD], Montgomery-Âsberg Depression Rating [MADRS], Clinical Global Impression [CGI] Scale) and functional status and quality-of-life measures (e.g., Sickness Impact Profile, Medical Outcomes Study SF-36).
One person initially screened titles and abstracts for inclusion criteria. Titles and abstracts that were rejected by this person were independently assessed by a second person. If either person had doubt about the appropriateness of excluding the study at the title-abstract stage, it was not excluded. There were 418 titles and abstracts that were rejected as definitely not meeting inclusion criteria.
Of the remaining 859 records, the text of 747 reports was obtained. One of 112 unobtainable reports was an article published in a journal not available through either the United States Interlibrary Loan system or the CCDAN group. 79 The other 111 unobtainable reports were abstracts from conference proceedings or titles identified from pharmaceutical company records and meta-analyses.37, 40, 48, 58, 69, 80-153 It is not known whether final reports are available for these abstracts and titles, but 63 (55 percent) were judged from the information available as very likely to meet inclusion criteria. When author contact information was available (n=34), letters were sent to determine eligibility and obtain a full report. Trials available in abstract form only were not considered eligible. We were unable to ascertain whether 51 abstracts and 1 article met selection criteria, were ongoing versus completed studies, or were duplicative studies.
At least two independent reviewers screened the full text of each of the 747 retrieved articles for final inclusion. There were 458 articles that met selection criteria; reviewers agreed on all selections (100 percent concordance). Most articles were easily excluded for obvious reasons (n=276); eligibility was difficult to ascertain in 13 cases (see pertinent references for specific difficulties).154-166
One-third of the reports were duplicate publications, and approximately 1 percent contained data concerning more than one trial. In total, 315 unique trials were abstracted from 312 primary articles.167-479 Figure 2 depicts the selection process.

Figure
Figure 2. Flow Diagram of Selection Process.
Duplicate publications are cited in Appendix 1.4. Duplicate publications were identified by an information specialist (nurse with library and reference management expertise) and a physician with clinical knowledge of the topic area and methodologic expertise. The following items were considered in assessing duplicate publications: author names; geographic locations of studies; and study designs including which drugs were studied, numbers of participants, study lengths, and outcome measures that were used. No single item mentioned above was adequate for identifying duplicate publications (e.g., there are examples of results of the same trial being reported by totally different authors). When the information specialist and physician could not determine whether a publication represented a duplication, authors and pharmaceutical companies were contacted for clarification.
Search and Selection for Uncommon but Serious Adverse Effects Question
The biomedical databases MEDLINE, EMBASE, and PsycLIT were searched for articles addressing rare but serious adverse effects. The search included articles of any study design (including case reports) that were original reports of serious adverse effects thought to be secondary to newer Food and Drug Administration (FDA)-approved antidepressants or hypericum. Unlike the searches for randomized trials assessing efficacy, this search was specifically limited to newer antidepressants that were FDA approved as of January 1998 (Figure 3).
Articles addressing serious adverse effects were identified with specific keywords and text words for the adverse effects defined by MedWatch and also with nonspecific keywords and text words such as "adverse," "serious," "severe," or "poisoning." Articles were narrowed down to those addressing the relevant drugs with appropriate keywords, text words, and, in the case of MEDLINE, registry numbers. Articles were not limited to the topic of depression. For details of the serious adverse effects search strategies, see Appendix 1.5.
The initial searches retrieved a total of 12,374 records. Forty-eight percent of the records were unique to EMBASE, 8 percent unique to MEDLINE, and 3 percent unique to PsycLIT. The remainder were found in at least two of the databases.
The titles and abstracts of an arbitrary sample of 3,298 records (27 percent of total) were screened by one person. There were 323 of these 3,298 records that were judged as meeting inclusion criteria. A search strategy that captured 93 percent of the thus-far included records was retrospectively devised. The revised strategy was then used to identify remaining articles warranting assessment. All 3,400 records returned by the revised search strategy were assessed for inclusion by one person.
There were 692 studies that met inclusion criteria. These studies included 52 controlled studies, 20 publications of postmarketing databases, and 620 case series or case reports. Complete texts of all controlled studies were dual abstracted by two independent reviewers. The drugs and adverse effects of the case series and reports were tabulated, based on the information presented in the titles and abstracts.
Data Collection and Abstraction Process
Abstraction forms are provided in Appendix 2.
Randomized Controlled Trials
Two independent persons abstracted data from each trial regarding participant and diagnostic descriptors, intervention characteristics, study designs, and clinical outcomes. Abstractors were not blinded to study title or author names. Items related to the internal validity of studies that were assessed included adequacy of randomization (method and concealment of assignment), whether the trial was single or double blind, cointerventions, and numbers of dropouts. A standard code book that explicitly defined each item was used.
Eight persons with pertinent clinical and methodology experience performed abstractions. They were trained and calibrated with each other using a pilot set of 20 trials. Reliability checks of abstractions were assessed in a 25 percent sample. For most items, agreement was greater than 95 percent. For diagnostic categorizations and reasons for dropouts, agreement was lower than 85 percent. Thus, a third independent person (physician with extensive clinical and methodologic expertise) confirmed diagnostic and dropout information. Because of its importance, the physician also verified a 90 percent sample of outcome assessments.
Disagreements were resolved by consensus. In the few instances where consensus was not easily reached, an additional person was consulted for arbitration. Abstractions were entered into an electronic database. Prior to data analysis, checks for outlier values were performed and data entries were corrected as appropriate.
Studies Addressing Uncommon Serious Adverse Effects
Studies addressing uncommon serious adverse effects were abstracted by three physicians with expertise in methodology. Items that were abstracted included study design (case report, case series, case control, cohort, controlled trial) and type of specific adverse effect. Several explicit criteria aimed at assessing drug adverse event causality were assessed such as appropriate temporal relationship, lack of apparent alternative causes, known toxic concentrations of the drug at the time of the appearance of the symptom, disappearance of the symptom with drug discontinuation, dose-response relationship, and reappearance of the symptom if the drug was readministered. Abstractions of the studies were discussed among the three physicians and consensus ratings were used. No formal reliability testing was done.
Methodologic Challenges to Interpreting the Evidence
Although randomized controlled trials are viewed by many as the scientific "gold standard" for assessing the efficacy of clinical treatments, several factors might affect the quality and usefulness of such evidence. In this evidence report, the following may limit ability to summarize, interpret, and apply results to clinical practice: publication bias; missing data about patient characteristics, cointerventions, and content of followup visits; possible selective reporting of data; high dropout rates; heterogeneity in diagnostic criteria; multiple outcome measures; inconsistent reporting of adverse events; and restrictive exclusion criteria and homogeneity in patient populations.
Publication Bias
The eligibility criteria for this review were randomized controlled trials lasting 6 weeks or longer that tested newer pharmacotherapies for depression and assessed clinical outcomes. Of the 1,277 records identified as possibly meeting eligibility criteria, we were unable to retrieve 112. These included one foreign language article published in a journal not available through the interlibrary loan service, abstracts published in conference proceedings, and unpublished reports (e.g., from pharmaceutical company files). Table 4 shows how many of each publication type were unobtainable and how many we were able to ascertain met inclusion criteria. The eligibility of other missing records was unclear.
Table
Table 4. Known missing records.
When the number of eligible missing trials is compared with that of eligible retrieved trials, several concerns about possible publication bias for specific agents are raised. Publication bias occurs when studies that are published or otherwise available for scientific review systematically give different results than studies that are rejected from publication, never submitted for review, or otherwise not yet available for review. For example, studies that show significant differences between treatments or that confirm the experimenter's hypothesis are more likely to be published than those that do not. 480 In the present review, there are more known missing trials than retrieved trials for mirtazapine and milnacipran, as shown in Table 5. Almost one-half of trials addressing efficacy of venlafaxine and almost a third of the nefazodone and sertraline trials were missing. These records represent trials that were known to be missing as of January 1998. (Of note, ongoing searches conducted through August 1998 identified several published trials that had previously been available only in abstract form or as citations in industry-conducted meta-analyses. These included one citalopram trial, one mirtazapine trial, three milnacipran trials, one nefazodone trial, two paroxetine trials, three sertraline trials, and three venlafaxine trials.)
Table
Table 5. Drugs used in known missing trials meeting criteriaa.
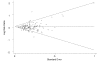
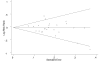
There are statistical tests that evaluate the possibility of publication bias in available data. Such tests provide gross estimates of whether a group of studies systematically overestimate or underestimate the treatment effect size. In this evidence report, two methods (i.e., funnel plots with Begg's rank order correlation test and Egger's regression approach) were used to estimate the possibility of publication bias whenever a quantitative analysis (meta-analysis) was performed. Funnel plots showing results of such analyses are given in Figures 4, 5 and 6. They suggest no evidence of publication bias for studies comparing newer agents with older agents (Begg's test, p=0.362) or studies comparing newer agents with newer agents (Begg's test, p=0.441). Publication bias suggesting a systematic overestimation of treatment effect (upward shift above 0 in horizontal axis for the funnel) is suggested for newer agents compared with placebo (Begg's test, p=0.002).
Figure
Figure 4. Funnel plot Newer Agent vs. Older Agent Trials.
Figure
Figure 5. Funnel Plot Newer Agent vs. Newer Agent Trials.

Figure
Figure 6. Funnel plot Newer Agent vs. Placebo Trials.
Unreported or Missing Data
Data were often missing or unreported for the following: sociocultural characteristics of study participants, methods for concealing randomization and allocation, specifics about how interventions were delivered, outcome values, and adverse events. Whether data reporting was selective in a manner that introduced particular biases could not be assessed.
Missing Data About Patient Characteristics
Of the 315 trials, 96 percent did not report the education level or socioeconomic status of the participants (Table 6), and 91 percent did not report ethnicity. Twelve percent did not report the gender of their participants. Few studies gave information about participants' comorbid illnesses, functional status, or health-related quality of life.
Table
Table 6. Number of trials not reporting sociodemographic data.
Unspecified Methods of Randomization and Concealment
Although all of the trials were randomized and the majority were double blind (i.e., randomization assignment was unknown to both investigators and subjects), few of the trials explicitly described adequate methods of randomization and allocation concealment (e.g., groups assigned by a central call-in office). Such methods specify that the person who makes group assignments is unaware of patient characteristics and cannot manipulate the randomization scheme. Because lack of adequate allocation concealment can be associated with bias, explicit descriptions of the randomization and concealment process are optimal.481, 482 Table 7 shows how many studies were double blind. Less than 5 percent of the trials commented on whether blinding was maintained or whether patients and investigators could guess which intervention was being administered.
Table
Table 7. Blinding of 315 trials.
Unreported Details About Intervention Delivery and Followup
The majority of studies did not report details regarding how interventions were delivered. For example, very few trials reported any information about the type of clinician (e.g., nurse, psychiatrist, research associate) who interacted with patients or whether any type of educational information or supportive therapy was provided to participants during the course of the trial. Whether the persons responsible for delivering the interventions had established therapeutic relationships with trial participants was rarely clear.
Planned followup visits varied from weekly to twice monthly to monthly. Almost all trials followed participants in clinic or hospital settings rather than in the home or by telephone. Trials were not designed to assess whether different intensity of followup was related to adherence, efficacy, or costs. Among trials of 12 weeks or shorter duration, average dropout rates in those with scheduled weekly followup was 31 percent whereas average dropout rates in those with scheduled followup every 2 weeks (bimonthly) was 22 percent. Whether varying intensities of followup schedules were related to differences in discontinuation rates among different drugs could not be determined (see section, Unreported Data for Adverse Events, Adherence, and Dropouts).
Although unplanned cointerventions such as benzodiazepines and psychosocial therapy were described in some trials, most did not report the number of participants who received the cointerventions. The extent to which the outcomes of these studies can be attributed solely to the tested antidepressants is not entirely clear.
Unreported Outcomes
Outcome data were not always comprehensively reported. Four percent of the studies did not provide any outcome data (Table 8). Of the 292 that did report outcomes, less than one-third reported variances for changes in depression scores from baseline to followup. These variances had to be estimated for meta-analyses and other summary statistics.
Table
Table 8. Outcome, adverse event, and dropout data not reported in 315 trials.
Most studies did not report outcomes using true intention-to-treat or last-observation-carried-forward methods. Some studies that used last-observation-carried-forward only did so for patients completing at least 3 weeks of treatment. The results of these studies could be biased by systematic differences in dropout rates between treatment arms.
Less than 5 percent of the trials reported health-related quality-of-life outcomes. Quality-of-life information would have been particularly useful as it is a global measure of functioning that allows proxy comparisons of both benefits and adverse effects across drugs. For example, dry mouth may occur with a particular agent and headaches or sexual dysfunction with another agent. Without a global measure of functioning, it is difficult to compare whether adverse effects in general are more troublesome with one agent than another.
Unreported Data for Adverse Events, Adherence, and Dropouts
Seven percent of the trials either did not assess or report adverse events. Of the 286 trials that assessed adverse events, approximately one-fourth did not report the number of patients who experienced particular adverse events. Rather, these trials listed the most frequently reported symptoms, the number of symptoms reported by a certain percentage of patients, or the number of times certain events were reported throughout the trial (presumably with multiple reports of the same symptom from individual patients). Thirteen percent of the trials did not provide data concerning dropouts (see Table 8).
Trials rarely provided information about adherence to assigned therapy. For example, only one large trial provided detailed information about numbers of visits completed and numbers of prescriptions filled. 427 Less than 5 percent of the trials reported pill counts. Another 11 percent provided numbers and reasons for dropouts that did not add up. When studies reported how many patients had dropped out for adverse events, they often failed to report what kinds of adverse events had prompted the dropouts. This is of interest because anecdotal evidence suggests that patients may be just as likely to stop taking medications for innocuous, but annoying side effects (e.g., dry mouth) as they are for serious side effects (e.g., hypotension). Letters were sent to 213 authors in an attempt to gather some of the unreported data noted above. Although we had a response rate of 30 percent, very little missing information was retrieved because either investigators had died or data were in storage.
Heterogeneity of Diagnostic Nomenclature
Several different diagnostic schemes (e.g., Diagnostic and Statistical Manual of Mental Disorders [DSM], Research Diagnostic Criteria [RDC], Endicott, Newcastle) and several different revisions of the same scheme (e.g., DSM-III, DSM-III-R, DSM-IV) were used in the trials to diagnose specific depressive disorders. Approximately 70 percent used either DSM-III or DSM-III-R criteria as the primary diagnostic tool. Several studies also required a certain severity of depression (usually determined by the Hamilton Depression Rating Scale) for inclusion criteria.
Some of the diagnostic criteria have evolved over the past two decades as our understanding of depressive disorders has increased. For example, unlike DSM-III, DSM-IV requires that the symptoms for major depression "cause clinically significant distress or impairment in social, occupational, or other important areas of functioning." Although the trend has been to develop more objective diagnostic criteria, there remains subjectivity and heterogeneity in applying them.
High Dropout Rates
Approximately 30 percent of participants in the 281 trials that reported such information dropped out prior to completing followup. Eleven percent dropped out due to adverse events, 9 percent dropped out due to lack of efficacy, and the remaining 11 percent dropped out for other reasons that were usually unspecified. Numbers of dropouts varied across trials, with approximately 30 percent of the trials reporting dropout rates of 20 percent or less, and 20 percent of the trials reporting dropout rates of 40 percent or more. Many experts consider high dropout rates a threat to internal validity, especially if the patients who drop out differ in systematic ways (e.g., in severity of depression, experience of adverse events) from the patients who remain in the study. The trials with high dropout rates rarely compared dropouts with completers for such systematic differences.
Subgroup analyses of major depression trials in this report compared effect sizes of trials with the following dropout rates: <20 percent versus >20 percent, <30 percent versus >30 percent, and <40 percent versus >40 percent (Table 9). These analyses showed no statistically significant differences in effects dependent on dropout rates. Specific results of these subgroup analyses are reported in Chapter 3, Quantitative Results of Effects of Design and Methodologic Characteristics on Response Rates. Meta-regression analysis that examined potential effects of dropout rates along with several other design and methodologic variables are reported in the same section.
Table
Table 9. Dropout rates of the 269 trials reporting such information.
Multiple Outcome Measures
The 293 studies that provided outcome data utilized approximately 30 different instruments to measure depression symptoms. Multiple assessment instruments were often used in the same study. Over 90 percent of studies reporting depression outcomes used one of the following depression assessment instruments: Hamilton Depression Rating Scale, Montgomery-Åsberg Depression Rating Scale, or Clinical Global Impression Scale (Table 10). Studies that used these instruments reported results in a variety of ways, including means, median or mean change, 50 percent response rate, "cure" rates, and "any improvement." The latter two methods were defined differently in different studies. The extent to which varying instruments and methods of reporting can be equated for statistical comparisons is not always clear. Some evidence suggests that the very use of multiple outcome measures and reporting methods increases the likelihood of selective reporting. 483 Treatments for depression can be found to be statistically significantly different when compared with other treatments on some outcome measures but not others. 484 Similarly, some outcome measures may be more likely to show significant differences for particular types of depressive disorders but not others. 43
Table
Table 10. Methods of reporting HAMD, MADRS, or CGI outcomes in 293 trials.
The Hamilton Depression Rating Scale was the single most commonly used outcome. This assessment scale relies on an assessor (usually a clinician) to interview a subject and rate symptoms according to specified criteria. Its reliability may depend on adequate blinding of assessors. Even though almost all of the studies were double blind, maintenance of double blinding was never reported. Fewer than 5 percent of the trials used separate investigators to monitor adverse effects and severity of symptoms. As adverse effects between agents such as SSRIs and TCAs differ, it is possible that investigators who were assessing outcomes were not always adequately blinded. As there is inevitable interest and optimism that new treatments will be beneficial, observer bias may have occurred. 57
Cultural Differences in Outcome Assessment
This evidence report includes studies conducted in over 20 countries. There may be systematic differences across cultures in the way in which depressive disorders are experienced, reported, and assessed. Outcomes that depend on a provider's or a patient's global assessment of functioning may be interpreted differently by different linguistic and cultural groups. When instruments are translated into different languages, the quality and meaning of the translation can be problematic. Studies, including multicenter trials conducted across several countries, rarely addressed the issue of the linguistic or cultural equivalence of outcome measures.
Inconsistent Reporting of Adverse Events
Adverse events were reported in a variety of ways. Of the 286 trials that assessed adverse events, 42 percent did not report the method of ascertainment. The remaining 160 trials used several methods (Table 11). Numbers and kinds of adverse events obtained from voluntary report, generic questioning, and standardized scales may differ and affect reliability of overall estimates.
Table
Table 11. Methods of assessing adverse events in 286 trials.
Statistical Concerns
Most trials were small, involving fewer than 100 subjects. Dropout rates were often greater than 30 percent, yielding even smaller effective sample sizes. Small trials were typically underpowered, making it difficult to interpret "negative" findings of individual studies when no statistically significant differences were found. Meta-analyses addressed some of these concerns but were not possible for many areas with few studies such as subsyndromal depression, mixed anxiety depression, and depression with concomitant comorbid medical illness.
Generalizability
Several additional problems could limit ability to apply the evidence to clinical practice. These include the use of restrictive inclusion criteria, prerandomization run-in periods, short trial duration, and methodologic restrictions of randomized controlled trials designed to assess treatment efficacy.
Inclusion and Exclusion Criteria
Most trials used restrictive inclusion and exclusion criteria. To ensure a homogenous patient sample, patients with significant medical and psychiatric comorbid conditions were usually excluded. Two-thirds of the trials explicitly stated exclusion criteria related to alcohol and other substance abuse; in all but three instances, participants with these conditions were excluded. Women who were pregnant or lactating, or who were not using a reliable form of birth control, were typically excluded because of safety concerns. The most severely depressed patients were also often excluded. Even though heterogeneous nomenclatures were used to define patients, the majority of trial participants had major depression of moderate severity. (The section addressing major depression gives detail on the severity of depression in most trial participants.) Many of the trial participants had past histories of depressive disorders and/or had previously received antidepressant therapy. Whether such participants represented a population who were refractory or responsive to prior therapy was usually not clear. Given this lack of data, it is not possible to generally conject whether trial effect sizes are overly optimistic or conservative for patients with a first untreated episode of depression.
Run-ins
Prerandomization run-in periods are often used in pharmacotherapy trials to exclude noncompliant subjects and placebo responders. The rationale is to reduce the number of participants who will respond to placebo and thus increase detectable differences between placebo and active treatments. Of the 214 trials that had run-in designs, 128 excluded placebo responders and other types of patients. Some evidence suggests that results of such trials overestimate benefits and underestimate risks of treatment. 485 However, meta-analysis of 101 trials included in the 1993 AHCPR guideline, 6 showed that trials with placebo run-ins did not have lower placebo response rates or higher drug-placebo differences. 486 Subgroup analysis of major depression trials in this report showed no major differences in effect sizes between trials with run-in periods and those without. (See section in Chapter 3, Quantitative Results of Effects of Design and Methodologic Characteristics on Response Rates)
Trial Length
Trials in this review lasted at least 6 weeks to provide adequate time to demonstrate treatment efficacy and dropout rates. 27 Although they ranged in length from 6 to 104 weeks, the majority (73 percent) lasted only 6 to 7 weeks (Table 12). These trials are still short in that they do not reflect typical clinical practice that recommends that patients be maintained on antidepressants for 6 months or longer. This is particularly unfortunate as much of the expense of antidepressant prescribing relates to long maintenance period recommendations for which we have little evidence.
Table
Table 12. Number of trials of varying lengths.
Types of Randomized Controlled Trials
The majority of studies were designed to assess efficacy -- whether drugs were effective under ideal and standardized conditions. As a result, trials were often rigidly conducted to meet certain methodologic standards. They often required that patients assigned to the same groups be treated exactly the same. Some did not allow drug dosages to be titrated or modified according to an individual subject's response to adverse effects or lack of efficacy, which is rarely the case in actual clinical practice. Moreover, there is a need to study effectiveness of clinical treatments as they are really delivered in clinical practice. 487 Such trials may be more informative for policymakers than are efficacy trials.
Data Analysis
Primary Measure of Treatment Effect
The primary measure of treatment effect was response rate. It was defined as a 50 percent or greater improvement in symptoms as assessed by a depression symptoms rating scale or a rating of much or very much improved as assessed by a global assessment method. This definition of response was chosen because it represents a clinically meaningful improvement and is commonly reported in depression trials. Outcome measures that were most often reported were the Hamilton Depression Rating Scale, the Montgomery-Âsberg Depression Rating Scale, and the Clinical Global Impression. If multiple outcomes were reported, HAMD data were used first, followed by MADRS and CGI data, respectively. Treatment-specific response rates were calculated across studies, based on the total number of responders divided by the total number randomized to that class of antidepressant.
The log risk ratio was used to estimate response rate. The log risk ratio
is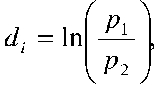
where p
1 and p
2 are the relative frequencies with which patients in the two comparison groups
show a clinically significant response to treatment. These values were transformed back to
risk ratios to facilitate clinical interpretation of the results. Since trials rarely
collected depression symptom outcomes in patients who dropped out, analyses were not based on
true intent-to-treat results. Rather, a modified intent-to-treat method was used.
488
The denominator for p
1, i=1,2, was the number randomized to treatment, and the numerator was the number
of patients who stayed in treatment and got better. Given that some patients who left
treatment may have gotten better, modified intent-to-treat response rates are more
conservative or lower than those derived from a true intent-to-treat analysis.
Secondary Measure of Effect
Quantitative change scores on the HAMD and MADRS were examined to confirm primary analyses
based on response rates. Standardized mean differences between mean change scores were the
effect size measure in these analyses. Hedges' g was used to compute the
standardized mean difference for each trial: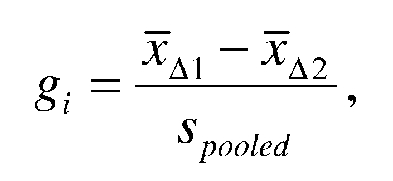 ,
,
where, for a given trial i,  and
and
 are the mean change scores for the two groups being compared and
S
pooled
is the pooled standard deviation for the difference between the two means.
489
These estimates were adjusted for small sample bias when the total sample size at the
posttreatment assessment was fewer than 50 patients.
489
are the mean change scores for the two groups being compared and
S
pooled
is the pooled standard deviation for the difference between the two means.
489
These estimates were adjusted for small sample bias when the total sample size at the
posttreatment assessment was fewer than 50 patients.
489
Published reports seldom provided estimates of S pooled three strategies was used to estimate S pooled when the authors did not directly provide it. First, the standardized mean difference was back calculated from either the test statistic or the p value for the difference between change scores. 490 If this was not possible, values for S pooled were imputed from the partial variance information provided in the published trial report. 491 If neither was possible, a mean variance derived from studies of similar size was used.
Partial variance information reported in the trials usually consisted of either the pretreatment standard deviations for the two groups or pre- and posttreatment standard deviations for the two groups. The posttreatment sample size for the two groups was used to calculate S pooled because it yielded a larger estimate for S pooled and thus a smaller more conservative estimate of the effect size.
Estimation of the variance of a change score also required an estimate of the "within trial correlation" between the pretreatment and posttreatment scores. "Within trial correlations" were estimated from data provided by some authors and from a current multisite trial. Correlations were pooled to yield a mean estimate (r=0.40) and 95 percent confidence interval.
Empirical Bayes Random-Effect Estimates
We adopted the DerSimonian and Laird empirical Bayes random-effects estimator to estimate the pooled measures of treatment efficacy.492, 493 Empirical Bayes estimators are particularly suited for relatively small samples (n=10 trials). If there is no substantial heterogeneity among the trials, the empirical Bayes estimator reduces to the classical fixed-effects estimate. When significant heterogeneity exists, the empirical Bayes estimator moves the point estimates of effect towards the overall mean, thereby decreasing heterogeneity.
The empirical Bayes estimator for each study is
where d
+ is the DerSimonian and Laird random effects for the overall treatment effect and
 is the commonly used moment estimator for the "between studies"
variance. Its variance is
is the commonly used moment estimator for the "between studies"
variance. Its variance is
where  We
performed all computations with the STATA meta command written by Sharp and Sterne
496
and Sharp.
493
We
performed all computations with the STATA meta command written by Sharp and Sterne
496
and Sharp.
493
Organization of Comparisons
Comparisons were organized into three major groupings: (1) newer agents versus placebo, (2) newer versus older agents, and (3) newer versus newer agents. Within major groupings, comparisons were arranged according to drug classes such as SSRIs versus TCAs. In trials that compared different doses of a newer agent with placebo or another agent, the group that received the minimum dose within the specified usual dose range was used. For multi-arm trials comparing more than one newer agent with placebo or an older agent, all comparisons were used.
Results for all pairwise comparisons were displayed in standard forest plots. A chi-square test for homogeneity was performed for each set of pairwise comparisons; p<0.20 was considered evidence for significant heterogeneity. Galbraith plots identified outlier studies that might help explain heterogeneity in estimates of treatment efficacy. 497 Publication bias was assessed with funnel plots using Begg's rank order correlation test and with Egger's regression approach. 498 STATA 5.0 (STATA Corporation) was used to perform all pairwise analyses and produce the graphical output. 499 Specifically, the meta command was used to compute and graph empirical Bayes estimates, 496 the galbar command to access homogeneity and produce Galbraith plots, 499 and the metabias command to examine publication bias. 500
Sensitivity Analysis
As previously stated, primary analyses were based on a modified intent-to-treat method. A sensitivity analysis was done based on an endpoint method. In this method, the denominator for the risk ratio was the number of participants who completed followup or whose last observation was carried forward.
Subgroup and Multivariate Analyses
Studies varied greatly with respect to a wide range of patient, treatment, design, and setting characteristics. Several were identified a priori as potentially affecting efficacy estimates. These characteristics were age, ethnicity, gender, education, presence of significant comorbid medical illness or concomitant substance abuse, history of treatment failure or recurrence, type and severity of depression, agent class, study duration, run-in design, dropout rates, and setting (outpatient, inpatient, primary care, mental health). As later noted, only age, gender, severity of depression, class of newer agent, dropout rates, and setting could be used in multivariate analyses because of limitations in the reporting of trials.
Primary subgroup analyses were done for trials conducted in older patients, primary care settings, patients with major depression, and patients with dysthymia. Additional analyses were done to examine the effects of study design (run-in phase, dropout rates) on outcomes. These additional analyses were restricted to major depression trials in order to maximize the number of studies in each category. "Run-in" was classified as studies without a run-in phase, studies using a run-in to exclude placebo responders, and studies using a run-in phase without stating if it was used to exclude placebo responders. Dropout rates were analyzed using three separate thresholds: dropout rates greater than 20 percent, 30 percent, and 40 percent. Choice of cut-off did not make a difference in the dropout analyses. Subgroup analyses provided a picture of how heterogeneity impacts treatment efficacy for a single characteristic. However, studies varied with respect to multiple characteristics; it is not possible to manage multiple covariates effectively in subgroup analyses. Thus, multivariate statistical models were used to examine the impact of multiple covariates on measures of treatment response.
Multivariate models were used to examine results across depressive disorders and, separately, for major depression studies only. They were performed separately for newer agent versus placebo studies and newer versus older agent studies. No multivariate models were constructed for newer versus newer agents because of the smaller number of studies in this category. Ethnicity and education were not used in multivariate models because trials rarely reported such data. Presence of significant comorbid illness and history of treatment failure were not used because there were few trials in these categories.
Multivariate models used random-effects meta-regression. 492 An iterative weighted least-squares method recommended by Morris produced a maximum likelihood empirical Bayes estimate of the regression parameters. 501 The method iterated between estimating the regression coefficients and estimating between study variance until a convergence criterion was reached. The log risk ratio was the response variable. The STATA command, metareg, was used for these analyses. 493
Since proportions are nonnormal, dichotomous measures, such as percent female patients, were transformed to the log odds scale. All covariates were represented as deviations from their respective means in the random-effects meta-regressions. By expressing the covariates as deviation scores, the intercept constant estimated the value of the log risk ratio at the mean value for the covariates.
Dropout Rates and Adverse Effects
Comparisons between newer and older agents were done using proportions of participants who discontinued therapy for any reason, for adverse effects, and for lack of efficacy. Such dropout analyses were limited to studies less than 13 weeks in duration because study duration is likely related to dropout percentages and there were few studies longer than 12 weeks.
The relative frequency of 12 commonly reported adverse effects, such as nausea and headache, was examined. Statistical analyses comparing adverse effects were done only for selective serotonin reuptake inhibitors versus tricyclic agents because this comparison was the only one that consistently had pertinent adverse effect data from at least 10 trials.
- Methodology - Treatment of Depression: Newer PharmacotherapiesMethodology - Treatment of Depression: Newer Pharmacotherapies
Your browsing activity is empty.
Activity recording is turned off.
See more...