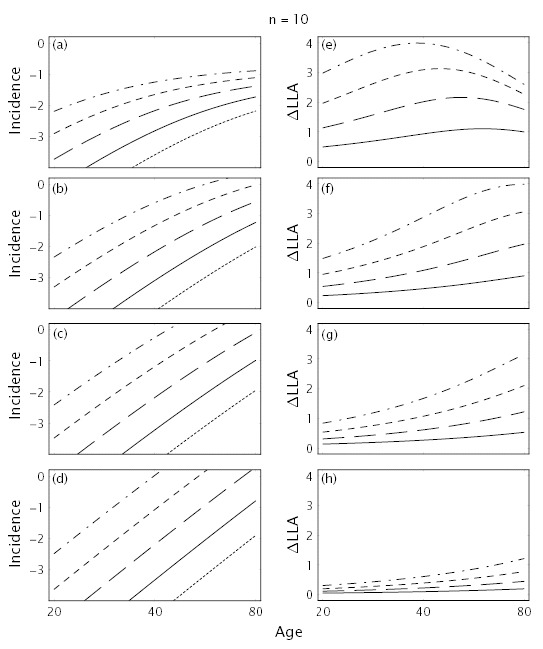
From: Chapter 7, Theory II

Dynamics of Cancer: Incidence, Inheritance, and Evolution.
Frank SA.
Princeton (NJ): Princeton University Press; 2007.
Copyright © 2007, Steven A Frank.
This book, except where otherwise noted, is licensed under a Creative Commons Attribution License, which permits unrestricted use, distribution, and reproduction in any medium, provided the original work is properly cited.
NCBI Bookshelf. A service of the National Library of Medicine, National Institutes of Health.
