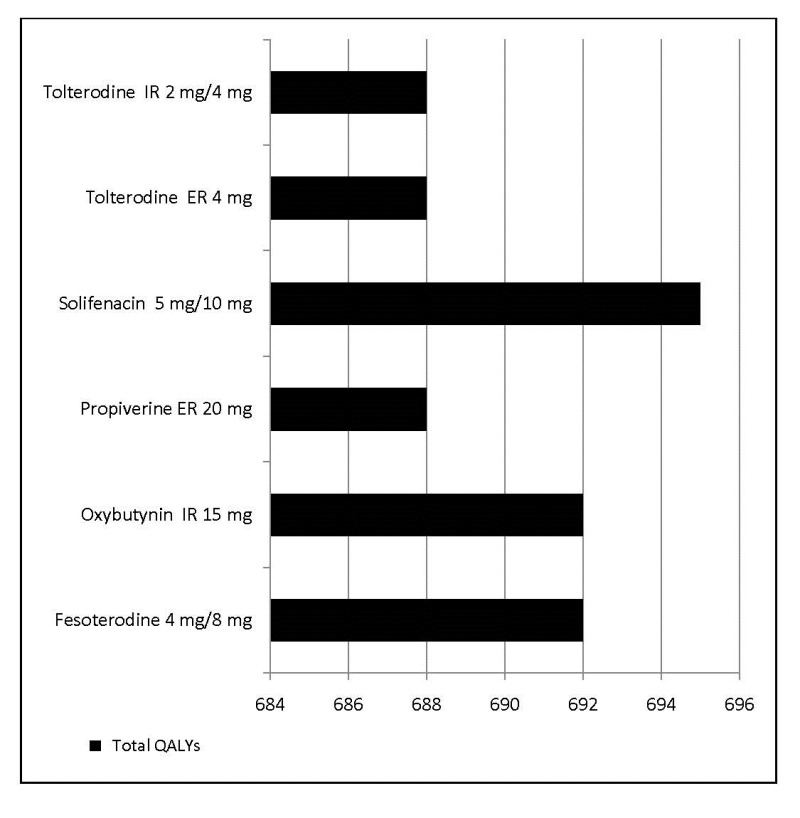
Figure F26 is a bar diagram depicting gains in quality adjusted life years per 1,000 treated patients after drugs for UI. The data came from evidence-based cost utility analysis. The horizontal axis presents total gains in quality adjusted life years per 1,000 treated. The black bars present gains in quality adjusted life years after each drug formulation. The figure demonstrates the largest gain in quality adjusted life years per 1,000 treated after administration of solifenacin.

Appendix Figure F26Gain in quality adjusted life years per 1,000 treated patients477

From: Appendix F, Evidence Tables and Evidence Figures

Cover of Nonsurgical Treatments for Urinary Incontinence in Adult Women: Diagnosis and Comparative Effectiveness
Nonsurgical Treatments for Urinary Incontinence in Adult Women: Diagnosis and Comparative Effectiveness [Internet].
Comparative Effectiveness Reviews, No. 36.
Shamliyan T, Wyman J, Kane RL.

NCBI Bookshelf. A service of the National Library of Medicine, National Institutes of Health.