NCBI Bookshelf. A service of the National Library of Medicine, National Institutes of Health.
Kiel JW. The Ocular Circulation. San Rafael (CA): Morgan & Claypool Life Sciences; 2010.
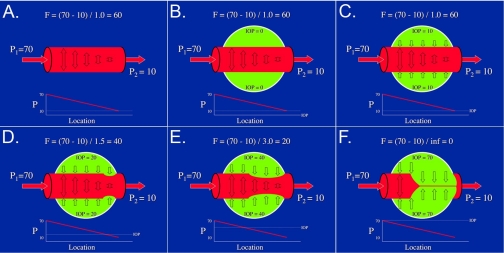
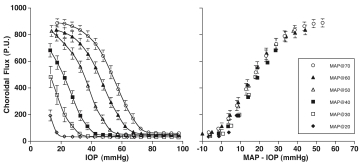
The pressure gradient from arterial input to venous output and the resistance imparted by the fluid composition and vascular geometry determine blood flow through a vessel or tissue. In the eye, the pressure gradients begin with the pressure in the supply arteries, i.e., the central retinal artery, the short posterior ciliary arteries, the long posterior ciliary arteries and the anterior ciliary arteries) and end with the venous pressures in the exiting veins (i.e., the central retinal vein and the vortex veins primarily). The resistance is set by the blood, and the net length, branching pattern and cross-sectional area of the specific circulation. In the eye, as elsewhere in the body, the pressure drop from the large supply arteries to the capillaries indicates that the primary site of resistance resides in the small arteries and arterioles. However, unlike most tissues, the intraocular veins experience a significant compressing force, the intraocular pressure (IOP), and so they act like Starling resistors, i.e., the pressure in the veins just before they exit the eye must exceed the IOP or they collapse (Fig 2.1)12–16. Consequently, the effective venous pressure for the ocular circulations is the IOP. For this reason, the ocular perfusion pressure (OPP) is defined as the mean arterial pressure (MAP, at eye level) minus the IOP. From this definition, it follows that raising the IOP while holding MAP constant at different levels should produce a family of pressure-flow curves, each going to zero when the IOP equals MAP, and these separate curves should resolve into a single curve when flow is plotted as a function of OPP. This behavior has been demonstrated in the rabbit choroid (Fig 2.2) and is assumed to be qualitatively similar in the other ocular circulations across species17.
Figure 4.1
Ocular Starling resistor. A. Vessel flow (F) is a function of the pressure gradient (P1 — P2) along the vessel divided by the resistance. B - C. If the vessel passes through an organ (e.g., the eye) with a low tissue pressure (e.g., IOP), the pressure inside the vessel exceeds the pressure outside the vessel (i.e., the transmural pressure gradient) and so the vessel remains distended. D - E. If the tissue pressure is somewhat higher and exceeds the pressure at the lowest point inside the vessel (i.e., at the “venous” end), that region of the vessel will begin to collapse, which will increase the resistance to flow in that segment thereby raising the intravessel pressure until the transmural pressure is again slightly positive. F. If the tissue pressure becomes greater than the arterial input pressure, the vessel will collapse completely, the resistance will be infinite, and flow through the vessel will cease.
Figure 4.2
Effect of IOP on an ocular circulation. Traces are rabbit choroidal (primarily choriocapillaris) blood flow (BFch) and blood volume (VOLch) responses to increasing IOP by intraocular saline infusion at 30 μl/min as mean arterial pressure (MAP) is held constant at ≈60, 70 and 80 mmHg. Blood flow ceases and blood is expelled (i.e., the vessels collapse) when the IOP reaches the MAP and the ocular perfusion pressure (OPP) goes to zero. When the infusion is halted, the IOP declines until the OPP is again greater than zero whereupon the blood flow resumes and begins refilling the vessels. (Author’s unpublished observations using LDF.).
Figure 4.3
Rabbit choroidal blood flow (Flux, measured by LDF) changes with IOP and OPP (MAP — IOP). Left: choroidal Flux response to increasing IOP at different MAPs. Choroidal Flux falls as IOP nears the MAP and ceases when IOP exceeds the MAP. Right: the same data with choroidal Flux plotted against MAP - IOP. The curves superimpose showing that MAP — IOP is the effective ocular perfusion pressure17. Reproduced with permission from Investigative Ophthalmology & Visual Science.
- Ocular perfusion pressure, IOP and the ocular Starling resistor effect - The Ocu...Ocular perfusion pressure, IOP and the ocular Starling resistor effect - The Ocular Circulation
Your browsing activity is empty.
Activity recording is turned off.
See more...


