From: Membrane Proteins
NCBI Bookshelf. A service of the National Library of Medicine, National Institutes of Health.
Alberts B, Johnson A, Lewis J, et al. Molecular Biology of the Cell. 4th edition. New York: Garland Science; 2002.

Molecular Biology of the Cell. 4th edition.
Show details
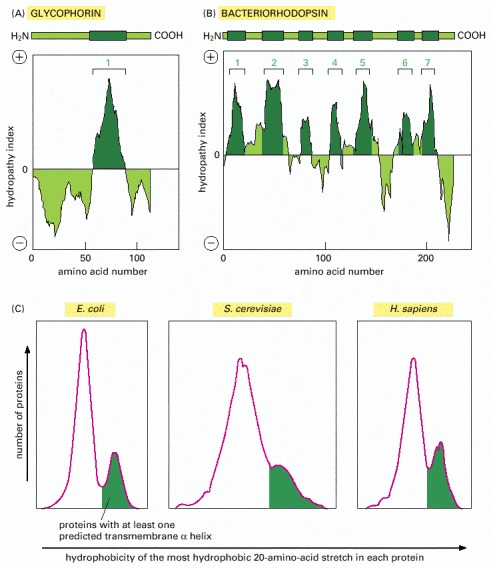
Figure 10-20Using hydropathy plots to localize potential α-helical membrane-spanning segments in a polypeptide chain
The free energy needed to transfer successive segments of a polypeptide chain from a nonpolar solvent to water is calculated from the amino acid composition of each segment using data obtained with model compounds. This calculation is made for segments of a fixed size (usually around 10–20 amino acids), beginning with each successive amino acid in the chain. The “hydropathy index” of the segment is plotted on the y axis as a function of its location in the chain. A positive value indicates that free energy is required for transfer to water (i.e., the segment is hydrophobic), and the value assigned is an index of the amount of energy needed. Peaks in the hydropathy index appear at the positions of hydrophobic segments in the amino acid sequence. (A and B) Two examples of membrane proteins discussed later in this chapter are shown. Glycophorin (A) has a single membrane-spanning α helix and one corresponding peak in the hydropathy plot. Bacteriorhodopsin (B) has seven membrane-spanning α helices and seven corresponding peaks in the hydropathy plot. (C) The proportion of predicted membrane proteins in the genomes of E. coli, S. cerevisiae, and human. The area shaded in green indicates the fraction of proteins that contain at least one predicted transmembrane helix. The curves for E. coli and S. cerevisiae represent the whole genome; the curve for human proteins represents an incomplete set; in each case, the area under the curve is proportional to the number of genes analysed. (A, adapted from D. Eisenberg, Annu. Rev. Biochem. 53:595–624, 1984; C, adapted from D. Boyd et al., Protein Sci. 7:201–205, 1998.)
- Figure 10-20, Using hydropathy plots to localize potential α-helical membrane-sp...Figure 10-20, Using hydropathy plots to localize potential α-helical membrane-spanning segments in a polypeptide chain - Molecular Biology of the Cell
Your browsing activity is empty.
Activity recording is turned off.
See more...