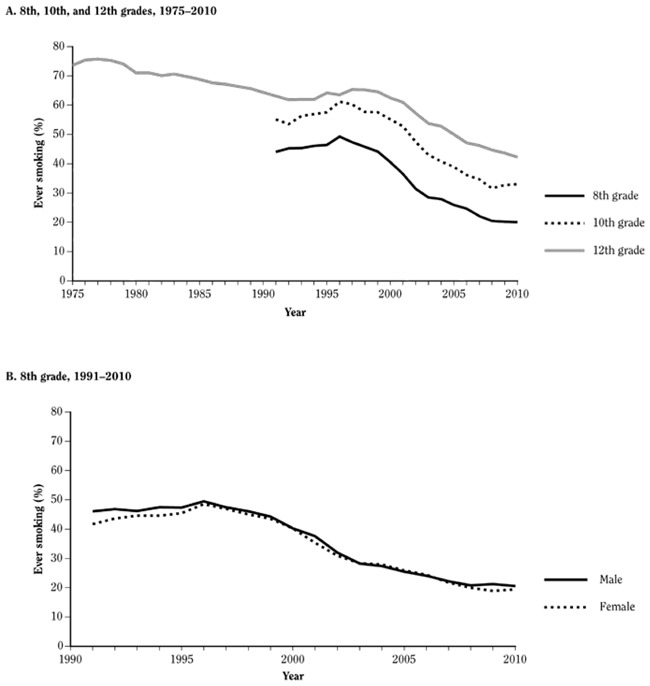
Figure 3.1.5A shows the trend lines for prevalence of ever smoking among students in 8th, 10th, and 12th grades from 1975–2010 according to the Monitoring the Future dataset. 12th grade students are from 1975–2010; 8th and 10th grade students are from 1991–2010. Prevalence of ever smoking has been decreasing for all 3 groups of students since 1998, after a period of increase from 1991–1997.Figure 3.1.5B shows the trend lines for prevalence of ever smoking among male and female students in 8th grade from 1991–2010 according to the Monitoring the Future dataset. Males and females have similar prevalence of ever smoking. The prevalence increased from 1991–1998, but has been steadily decreasing since 1998.Figure 3.1.5C shows the trend lines for prevalence of ever smoking among male and female students in 10th grade from 1991–2010 according to the Monitoring the Future dataset. The prevalence of ever smoking is similar for both males and females, and peaked 1997 around 60%. This prevalence has been decreasing since 1998, and in 2010 was around 40% for both male and female 10th grade students.Figure 3.1.5D shows the trend lines for prevalence of ever smoking among male and female students in 12th grade from 1976–2010 according to the Monitoring the Future dataset. The prevalence of ever smoking for male and female 12th grade students peaked around 75% in 1976, and has been decreasing since; however, there was a slight increase between 1996 and 1997. In 2010, about 50% of 12th grade males have ever smoked, while about 45% of 12th grade female students reported ever smoking.

Figure 3.1.5Trends in prevalence (%) of ever smoking among young people over time, by grade level and gender; Monitoring the Future (MTF) 1975–2010; United States

Source: 1975–2010 MTF: University of Michigan, Institute for Social Research (unpublished data).

From: 3, The Epidemiology of Tobacco Use Among Young People in the United States and Worldwide

Cover of Preventing Tobacco Use Among Youth and Young Adults
Preventing Tobacco Use Among Youth and Young Adults: A Report of the Surgeon General.
National Center for Chronic Disease Prevention and Health Promotion (US) Office on Smoking and Health.

NCBI Bookshelf. A service of the National Library of Medicine, National Institutes of Health.