Influenza and Pneumococcal Vaccination
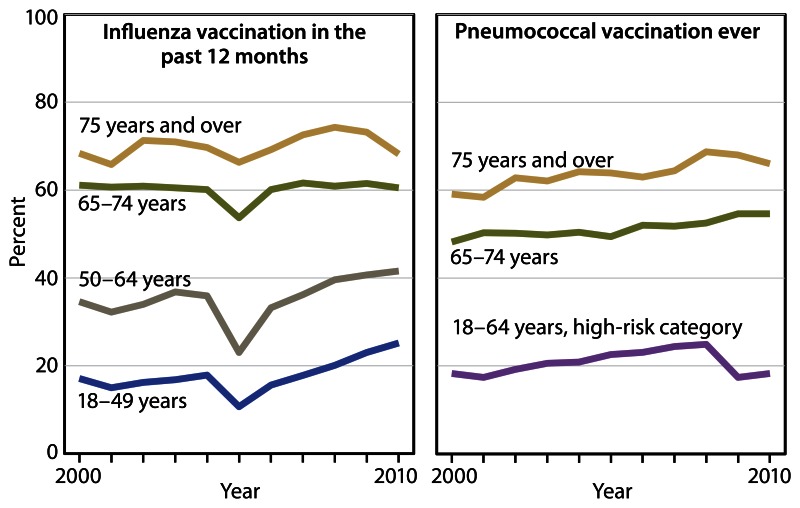
Between 2000 and 2010, influenza vaccination increased among adults under 65 years of age and pneumococcal vaccination increased among those 65 years of age and over.
Vaccination of persons at risk for complications from influenza and invasive pneumococcal disease is an important public health strategy (11). Between 2000 and 2010, influenza vaccination in the past 12 months for noninstitutionalized adults increased among those 18–49 and 50–64 years of age but was stable among those 65 years of age and over. Decreases in influenza vaccination coverage in 2005 were related to a vaccine shortage (12). Between 2000 and 2010, the percentage of noninstitutionalized adults who had ever received pneumococcal vaccination increased among those 65–74 and 75 years of age and over.
Figure 12Influenza and pneumococcal vaccination among adults, by type of vaccination and age: United States, 2000–2010
Excel and PowerPoint: http://www.cdc.gov/nchs/hus/contents2011.htm#fig12
SOURCE: CDC/NCHS, Health, United States, 2011, Tables 88 and 89. Data from the National Health Interview Survey (NHIS).
Mammography Use
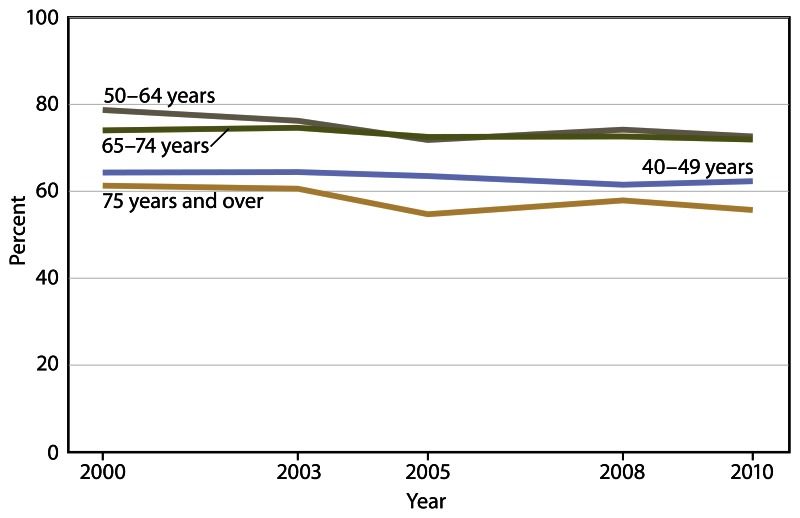
Between 2000 and 2010, mammography use was stable among all age groups of women 40 years of age and over.
In 2010, an estimated 207,000 women in the United States developed invasive breast cancer and 40,000 women died of this disease (13). Mammography recommendations changed in 2009. Currently, the U.S. Preventive Services Task Force recommends mammography screening every 2 years for women 50–74 years of age, and the American Cancer Society recommends annual screening starting at age 40 (14,15). Between 2000 and 2010, mammography use within the past 2 years was stable among all age groups of women 40 years of age and over.
Figure 13Mammography use in the past 2 years among women 40 years of age and over, by age: United States, 2000–2010
Excel and PowerPoint: http://www.cdc.gov/nchs/hus/contents2011.htm#fig13
SOURCE: CDC/NCHS, Health, United States, 2011, Table 90. Data from the National Health Interview Survey (NHIS).


