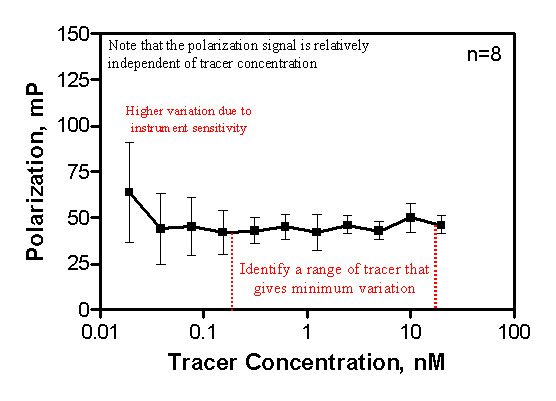
From: Receptor Binding Assays for HTS and Drug Discovery

All Assay Guidance Manual content, except where otherwise noted, is licensed under a Creative Commons Attribution-NonCommercial-ShareAlike 3.0 Unported license (CC BY-NC-SA 3.0), which permits copying, distribution, transmission, and adaptation of the work, provided the original work is properly cited and not used for commercial purposes. Any altered, transformed, or adapted form of the work may only be distributed under the same or similar license to this one.
NCBI Bookshelf. A service of the National Library of Medicine, National Institutes of Health.
