

NCBI Bookshelf. A service of the National Library of Medicine, National Institutes of Health.
Data Points Publication Series [Internet]. Rockville (MD): Agency for Healthcare Research and Quality (US); 2011-.

From 2006 to 2009, over 800,000 Medicare fee-for-service beneficiaries continuously enrolled in Parts A and B had a claim for an anticancer biologic of interest.
Bevacizumab was the most frequently used anticancer monoclonal antibody and its use doubled from 2006 to 2009.
In 2009, the total Medicare reimbursement for all anticancer monoclonal antibodies billed for in Medicare Part B noninstitutional and institutional outpatient settings exceeded $2 billion.
Cancer causes considerable morbidity and mortality in older adults. Of the 1.4 million Americans diagnosed with cancer each year, Medicare covers 61 percent.1 This proportion will increase to 70 percent by 2030.1 The overall prevalence of cancer in the Medicare population is estimated to be 17 percent.2 Therefore, based on 2010 enrollment data,3 nearly 8 million Medicare beneficiaries have cancer. Further, one in five Medicare beneficiaries will die from cancer,4 second only to heart disease. Accordingly, Medicare reimburses a major share of total spending on cancer treatment, 45 percent of the estimated $72 billion in costs (in 2004).4 In 2006, cancer care represented 1 in 10 Medicare fee-for-service (FFS) payments (excluding Part C advantage plans and Part D prescription drug expenditures).4 Lung, colorectal, prostate, and breast cancers dominated expenditures.4
Drugs used in the treatment of cancer account for a large share of Medicare Part B drug expenditures. These expenditures nearly tripled from $3 billion in 1997 to $11 billion in 2004. By contrast, total Medicare expenditures increased 47 percent during the same period.5 In 2008, five of the six medications accounting for the largest proportion of Part B drug expenditures treated either cancer or potential sequelae of cancer (e.g., anemia).4 Two of these drugs, rituximab and bevacizumab, are biologics. Limited literature describes Medicare Part D expenditures for cancer treatment, and even less describes expenditures for anticancer biologics. Using 2006 data, the Centers for Medicare & Medicaid Services (CMS) reported on the top 100 Part D drugs with the highest total gross drug costs to prescription drug plans. Imatinib ranked highest among anticancer biologics, at #90.6 In 2008, CMS reported on the top 10 Part D biologics by cost. Peginterferon alfa-2a ranked highest among anticancer biologics, at #9.7 Although the Food and Drug Administration (FDA) has labeled peginterferon alfa-2a for use in hepatitis, off-label uses include renal cell carcinoma and chronic myelogenous leukemia.
This brief defines biologics as “therapeutics produced through recombinant deoxyribonucleic acid technology or other biological processes.”8 Synthetic insulin was the first biologic, approved in 1982. Since, biologics have been developed to treat a variety of conditions other than diabetes, such as multiple sclerosis, arthritis, osteoporosis, Crohn’s disease, and cancer.9 As understanding of molecular biology and carcinogenesis has evolved, new anticancer biologics have entered the marketplace.10 Further, the development pipeline contains numerous biologics that promise novel anticancer therapies.
While some studies have shown that anticancer biologics improve patients’ quality of life and clinical outcomes, others have not. Of note, these agents are quite expensive.9,11 Annual average treatment costs of biologics can be up to 20 times greater than the costs of non-biologic counterparts.12,13 Health care professionals and policymakers have become concerned about (1) the effectiveness of some anticancer biologics, (2) issues of access, management, and ethics in delivering biologics to large-scale patient populations, and (3) cost containment.9,11 Quantifying the utilization and costs of anticancer biologics constitutes a necessary preliminary step to addressing these issues5 and emphasizes the importance of comparative effectiveness research in this area. Such research is especially important given the large number of Medicare beneficiaries with cancer, the significant number treated with anticancer biologics, and the potential toxicities of these therapies. This brief therefore examines utilization and costs of the following classes of anticancer biologics within Medicare Parts A, B, and D claims: monoclonal antibodies (Figure 1), kinase inhibitors, biologic response modifiers, other immunomodulators, other immunosuppressives, and miscellaneous biologic nonblood products. Hematopoietics used for sequelae of cancer (e.g., filgrastim) were not examined.
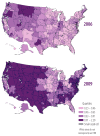
Figure 1
Proportion (%) of Medicare FFS beneficiaries with a claim for a monoclonal antibody, by geography, 2006 vs. 2009.
FINDINGS
Utilization of Biologics
From 2006 to 2009, 811,441 Medicare FFS beneficiaries continuously enrolled in Parts A and B throughout the calendar year while alive used biologics with an indication for or off-label use in cancer. For simplicity, Medicare FFS beneficiaries continuously enrolled in Parts A and B throughout the calendar year while alive are hereafter referred to as the Medicare FFS population. The number of beneficiaries using anticancer biologics of interest increased from 261,965 in 2006 to 359,113 in 2009. Counts of beneficiaries with anticancer biologic claims, by active ingredient, can be found online (www.effectivehealthcare.ahrq.gov/index.cfm/search-for-guides-reviews-and-reports/?pageaction=displayproduct&productid=509&preview=1).
Among monoclonal antibody biologics, bevacizumab and rituximab were most frequently used. Bevacizumab was used by a mean of 42.61 persons per 10,000 Medicare FFS beneficiaries (greater than 355,000 persons overall) during the 2006 to 2009 study period. Bevacizumab use more than doubled during the 4-year study period, increasing from 107.36 orders per 10,000 Medicare FFS beneficiaries in 2006 to 236.70 per 10,000 beneficiaries in 2009. Rituximab was used by a mean of 19.39 persons per 10,000 Medicare FFS beneficiaries (greater than 155,000 persons overall) during the study period, with 97.40 orders per 10,000 beneficiaries in 2009. Rituximab use remained stable over the study period. Cetuximab and trastuzumab were used less frequently, with means of 3.56 and 4.02 persons per 10,000 Medicare FFS beneficiaries with claims, respectively. Cetuximab and trastuzumab use remained stable over the study period, with rates near 35 and 55 orders per 10,000 Medicare FFS beneficiaries, respectively.
The use of other monoclonal antibodies was extremely limited. See Figure 1 for the distribution of monoclonal antibody use in 2006 versus 2009, by geography.
Among kinase inhibitors, erlotinib and imatinib were most frequently used. Erlotinib was used by a mean of 2.88 persons per 10,000 Medicare FFS beneficiaries (nearly 29,000 persons overall) during the study period, with 11.82 orders per 10,000 beneficiaries in 2009. Erlotinib use remained stable during the study period. Imatinib was used by a mean of 1.78 persons per 10,000 Medicare FFS beneficiaries (greater than 10,000 persons overall) during the study period, with 16.26 orders per 10,000 beneficiaries in 2009. Imatinib use increased slightly during the study period. The use of other kinase inhibitors was extremely limited. See Figure 2 for the distribution of kinase inhibitor use in 2006 versus 2009, by geography.
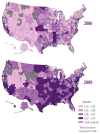
Figure 2
Proportion (%) of Medicare FFS beneficiaries with a claim for a kinase inhibitor, by geography, 2006 vs. 2009.
Among biologic response modifiers, Bacillus Calmette-Guerin (BCG) was most frequently used. BCG was used by a mean of 9.29 persons per 10,000 Medicare FFS beneficiaries (nearly 80,000 persons overall) during the study period, with 54.13 orders per 10,000 beneficiaries in 2009. The use of other biologic response modifiers was extremely limited. Of interest, denileukin use decreased more than 20-fold from 2006 compared to 2007–2009 (~17 versus ~0.7 orders per 10,000 Medicare FFS beneficiaries). The timing of this decline coincided with an FDA warning issued with regard to the loss of visual acuity in persons treated with denileukin.
Among other and miscellaneous immunomodulators and immunosuppressives, cyclosporine, octreotide, bortezomib, lenalidomide, and peginterferon alfa-2a were most frequently used. Cyclosporine was used by a mean of 7.26 persons per 10,000 Medicare FFS beneficiaries (greater than 38,000 persons overall) during the study period, with 73.12 orders per 10,000 beneficiaries in 2009.
Cyclosporine use declined consistently over the study period, although minimally. Octreotide was used by a mean of 3.53 persons per 10,000 Medicare FFS beneficiaries (nearly 30,000 persons overall) during the study period, with 23.98 orders per 10,000 beneficiaries in 2009. Octreotide use remained stable over the study period. Bortezomib was used by a mean of 3.22 persons per 10,000 Medicare FFS beneficiaries (nearly 29,000 persons overall) during the study period. Bortezomib use nearly doubled during the 4-year study period, increasing from 35.49 orders per 10,000 Medicare FFS beneficiaries in 2006 to 66.83 per 10,000 beneficiaries in 2009. Lenalidomide was used by a mean of 1.68 persons per 10,000 Medicare FFS beneficiaries (greater than 14,000 persons overall) during the study period. Lenalidomide use increased nearly five-fold during the study period, increasing from 2.60 orders per 10,000 Medicare FFS beneficiaries in 2006 to 12.81 per 10,000 beneficiaries in 2009. Peginterferon alfa-2a was used by a mean of 1.68 persons per 10,000 Medicare FFS beneficiaries (greater than 15,000 persons overall) during the study period, with 8.82 orders per 10,000 beneficiaries in 2009.
See Table 1 for rates of exposure to biologics of interest. Rates of exposure to biologics, as stratified by age, gender, and race/ethnicity, can be found online. Furthermore, counts of biologic orders by active ingredient can be found online (www.effectivehealthcare.ahrq.gov/index.cfm/search-for-guides-reviews-and-reports/?pageaction=displayproduct&productid=509&preview=1).
Table 1
Medicare FFS beneficiaries with at least one Part A, B, or D claim for an anticancer biologic of interest, 2006–2009.
Cost of Biologics
Total Medicare reimbursement for biologics of interest was calculated within the Medicare Carrier (formerly Physician/ Supplier Part B) file, a dataset containing final action claims submitted by noninstitutional providers (e.g., physicians, physician assistants, nurse practitioners). In 2009 alone, the total Medicare reimbursement for monoclonal antibodies of interest (as billed via the Carrier file) was greater than $1.5 billion. See Figure 3 for monoclonal antibody-specific trends in reimbursement over the study period. The total Medicare reimbursement for biologic response modifiers of interest in 2009 was nearly $21 million. See Figure 4 for biologic response modifier-specific trends in reimbursement over the study period. Temsirolimus, a kinase inhibitor, accounted for nearly $20 million in total Medicare reimbursement in 2009. Other and miscellaneous immunomodulators and immunosuppressives of interest accounted for more than $226 million in 2009, driven by reimbursement for bortezomib and octreotide. Trends in total Medicare reimbursement over the study period for biologics other than the monoclonal antibodies or biologic response modifiers are available online in tabular form (www.effectivehealthcare.ahrq.gov/index.cfm/search-for-guides-reviews-and-reports/?pageaction=displayproduct&productid=509&preview=1).
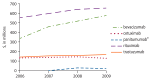
Figure 3
2006–2009 total Medicare reimbursement, as billed via the Carrier file, for monoclonal antibodies of interest accounting for at least $20 million in costs in 2009.
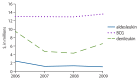
Figure 4
2006–2009 total Medicare reimbursement, as billed via the Carrier file, for biologic response modifiers of interest.
Total Medicare reimbursement for biologics of interest was also calculated within the Medicare Outpatient Standard Analytical File, a dataset containing final action claims submitted by institutional outpatient providers (e.g., hospital outpatient departments, rural health clinics). In 2009 alone, the total Medicare reimbursement for monoclonal antibodies of interest (as billed via the Outpatient file) was greater than $663 million. See Figure 5 for monoclonal antibody-specific trends in reimbursement over the study period. The total Medicare reimbursement for biologic response modifiers of interest in 2009 was greater than $6 million. See Figure 6 for biologic response modifier-specific trends in reimbursement over the study period. Temsirolimus, a kinase inhibitor, accounted for more than $6.5 million in total Medicare reimbursement in 2009. Other and miscellaneous immunomodulators and immunosuppressives of interest accounted for more than $95 million in 2009, driven by reimbursement for bortezomib and octreotide.
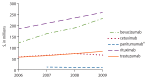
Figure 5
2006–2009 total Medicare reimbursement, as billed via the Outpatient file, for monoclonal antibodies of interest presented in Figure 3.

Figure 6
2006–2009 total Medicare reimbursement, as billed via the Outpatient file, for biologic response modifiers of interest.
Trends in total Medicare reimbursement over the study period for biologics other than the monoclonal antibodies or biologic response modifiers are available online in tabular form (www.effectivehealthcare.ahrq.gov/index.cfm/search-for-guides-reviews-and-reports/?pageaction=displayproduct&productid=509&preview=1).
Total Medicare reimbursement for biologics of interest was also calculated within the Medicare Durable Medical Equipment file, a dataset containing final action claims submitted by durable medical equipment suppliers. Other than cyclosporine, biologics of interest are not typically billed for via this mechanism. These results can be found online in tabular form (www.effectivehealthcare.ahrq.gov/index.cfm/search-for-guides-reviews-and-reports/?pageaction=displayproduct&productid=509&preview=1).
Total out-of-pocket expenses and total drug costs were calculated within the Medicare Part D Prescription Drug Event (PDE) file, a dataset containing summary records of drug dispensing from prescription drug plan sponsors. In 2009 alone, the total out-of-pocket expense and total drug cost for monoclonal antibodies of interest (as billed via the Part D file) were greater than $2.2 million and $15.7 million, respectively. The total out-of-pocket expense and total drug cost for biologic response modifiers of interest in 2009 were minimal, at around $45,000 and $191,000, respectively. The total out-of-pocket expense and total drug cost for kinase inhibitors of interest in 2009 were greater than $87 million and $475 million, respectively. See Figure 7 and Figure 8 for kinase inhibitor-specific trends in total out-of-pocket expense and total drug cost over the study period. The total out-of-pocket expense and total drug cost for other and miscellaneous immunomodulators and immunosuppressives of interest were greater than $63 million and $378 million in 2009, respectively. See Figure 9 and Figure 10 for other and miscellaneous immunomodulator and immunosuppressive-specific trends in total out-of-pocket expense and total drug cost over the study period.
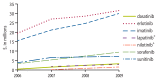
Figure 7
2006–2009 total out-of-pocket expenses, as identified via the Part D file, for kinase inhibitors of interest accounting for at least $1 million in expenses in 2009.
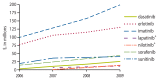
Figure 8
2006–2009 total drug costs, as identified via the Part D file, for kinase inhibitors of interest presented in Figure 7.
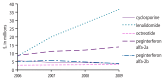
Figure 9
2006–2009 total out-of-pocket expenses, as identified via the Part D file, for other and miscellaneous immunomodulators and immunosuppressives of interest accounting for at least $3 million in expenses in 2009.
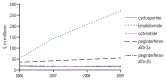
Figure 10
2006–2009 total drug costs, as identified via the Part D file, for other and miscellaneous immunomodulators and immunosuppressives of interest presented in Figure 9.
Expenditures related to biologics billed for in other Medicare claims files (such as the Inpatient Standard Analytical File) are not reported, since the bundling of payments made it difficult to determine costs solely attributable to the drugs themselves.
Indications for Biologics
Please refer to a companion Data Points brief for a detailed presentation of data on the types of cancers in which these biologics are used, as examined in the study population.
DATA SOURCE
The Department of Health and Human Services’ Medicare data were used for this brief. The use of these data was covered under a project-specific data use agreement with CMS. Specifically, the Medicare Enrollment Database (EDB) was used as a source of demographic information and Medicare Parts A and B enrollment data. EDB data through April 2010 were queried. The Common Working File (CWF) was used to identify claims for biologics billed under Medicare Parts A and B. CWF data from January 1, 2006, through April 9, 2010, were queried. PDE data were used to identify Medicare Part D eligibility and biologics billed under Part D. PDE data from January 2006 through April 2010 were queried.
STUDY PERIOD
The study period over which biologic utilization and costs were examined included 2006–2009.
DEFINITIONS AND METHODOLOGY
Eligible Beneficiaries
The population of eligible beneficiaries in a given year was composed of Medicare beneficiaries continuously enrolled in Parts A and B FFS throughout the given calendar year (while alive).
Identification of Biologics
Biologics included for study were limited to those having an indication for cancer or off-label use in cancer. Biologics were identified in Medicare Parts A and B claims via Healthcare Common Procedure Coding System (HCPCS) codes (e.g., J codes, A codes) and Current Procedural Terminology (CPT) codes (see Table 2). Biologics were identified in Medicare Part D claims via National Drug Codes (NDCs) (codes available from the authors). When biologics are introduced to the market, they are often assigned nonspecific HCPCS codes (e.g., J9999) for a period of time.
Table 2
HCPCS and CPT codes used to identify biologics of interest during the study period.
Biologics were excluded from consideration when billed for via these codes during the study period. For example, ofatumumab was approved by the FDA on October 26, 2009, and has since been billed using J9999. Therefore, ofatumumab was excluded from these analyses. Panitumumab was approved by the FDA on September 27, 2006, and was billed using J9999 through December 31, 2006, C9235 from January 1, 2007, through December 31, 2007, and J9303 from January 1, 2008, onward. Therefore, claims for panitumumab prior to January 1, 2007, were excluded from these analyses.
Calculation of Beneficiary and Biologic Order Counts
For each year of the study period, we: (a) used the EDB to restrict the study population to beneficiaries who were continuously enrolled in Medicare Parts A and B FFS throughout the year; (b) used the CWF to extract all Parts A and B claims containing HCPCS or CPT codes for biologics of interest; (c) used PDE data to extract all Part D events containing NDCs for biologics of interest; (d) calculated the number of orders for biologics and number of unique beneficiaries with at least one biologic order, per 10,000 eligible beneficiaries; (e) used the EDB to extract demographics of these beneficiaries; and (f ) calculated the number of unique beneficiaries with a biologic order in each demographic category, per 10,000 eligible beneficiaries.
Calculation of Payments for Biologics
For each year of the study period in the study population described above, we calculated payment separately for Outpatient, Carrier, Durable Medical Equipment, and Part D claims. For Outpatient file claims, we calculated total Medicare reimbursement for each biologic by summing the revenue payment variable across all line items with an HCPCS code for the biologic of interest. For Carrier and Durable Medical Equipment file claims, we calculated total Medicare reimbursement for each biologic by summing the line payment variable across all line items with an HCPCS code for the biologic of interest. For Part D file events, we calculated the annual total drug cost as the sum of the ingredient cost, dispensing fee, sales tax, and vaccine administration fee across all claims for biologics of interest. The vaccine administration fee became effective in 2008. Also, for Part D, we calculated the total beneficiary out-of-pocket expense as the sum of patient pay, true out-of-pocket-amount, and low-income subsidy amount across all claims for biologics of interest.
Generation of Maps
Maps were generated using Dartmouth Atlas of Health Care (www.dartmouthatlas.org) hospital referral regions (HRRs). Beneficiary Zip Code of residence, as of December 31 of the given year, was extracted from the EDB and crosswalked to HRRs. The proportions of beneficiaries with claims for a biologic or biologic class of interest were grouped into quartiles** and mapped accordingly. Regions with fewer than 11 beneficiaries in the numerator or denominator were mapped in gray and labeled as “small-sized cell.” Geographic regions that did not correspond to an HRR were mapped in white.
ADDITIONAL FINDINGS AVAILABLE ONLINE
The following additional tables and maps are available online at www.effectivehealthcare.ahrq.gov/index.cfm/search-for-guides-reviews-and-reports/?pageaction=displayproduct&productid=509&preview=1.
Number of Claims for Biologics of Interest Among Continuously Enrolled AB FFS Population By Class of Drug and Active Ingredient, 2006–2009 (MS Excel, 41K)
Total Medicare Reimbursement for Biologics of Interest in Outpatient Claims Among Continuously Enrolled AB FFS Population, 2006–2009 (MS Excel, 37K)
Utilization of Biologics of Interest, by Class of Drugs and Dartmouth Atlas of Health Care HRR, 2006–2009 (MS Excel, 216K)
Utilization of Selected Biologics of Interest, By Active Ingredient and Dartmouth Atlas of Health Care HRR, 2009 (MS Excel, 84K)
MAPS
Annual Utilization of Biologic Response Modifiers, by HRR, 2006–2009 (MS Excel, 264K)
Annual Utilization of Kinase Inhibitors, by HRR, 2006–2009 (MS Excel, 261K)
Annual Utilization of Miscellaneous Biologic Nonblood Products, by HRR, 2006–2009 (MS Excel, 267K)
Annual Utilization of Monoclonal Antibodies, by HRR, 2006–2009 (MS Excel, 258K)
Annual Utilization of Other Immunomodulators, by HRR, 2006–2009 (MS Excel, 262K)
Annual Utilization of Other Immunosuppressives, by HRR, 2006–2009 (MS Excel, 263K)
Annual Utilization of BCG, by HRR, 2009 (MS Excel, 88K)
Annual Utilization of Bevacizumab, by HRR, 2009 (MS Excel, 87K)
Annual Utilization of Bortezomib, by HRR, 2009 (MS Excel, 89K)
Annual Utilization of Cyclosporine, by HRR, 2009 (MS Excel, 89K)
Annual Utilization of Imatinib, by HRR, 2009 (MS Excel, 89K)
Annual Utilization of Rituximab, by HRR, 2009 (MS Excel, 88K)
Annual Utilization of Trastuzumab, by HRR, 2009 (MS Excel, 89K)
REFERENCES
- 1.
- American Society of Clinical Oncology. Medicare cuts threaten access to cancer care in the United States. 2009. [Accessed: September 14, 2010]. Available at: www
.asco.org/ASCOv2/Department %20Content /Communications/Downloads /medicare_cuts_09.pdf. - 2.
- Ke X, Hendrick F, Shaffer T, et al. Out-of-pocket (OOP) spending burden for Medicare beneficiaries with cancer. [abstract]. Presented at: AcademyHealth Annual Research Meeting; June 2010; Boston. [Accessed: September 14, 2010]. Available at: www
.academyhealth.org /files/ARM/PodiumPresentationsCallforPapers.pdf. - 3.
- The Henry J. Kaiser Family Foundation. Total number of Medicare beneficiaries. 2010. [Accessed September 14, 2010]. Available at: wwwstatehealthfactsorg
/comparetablejsp?ind =290&cat=6&sub =74&yr =138&typ=1&sort=a. - 4.
- American Cancer Society, Cancer Action Network. Cancer and Medicare: a chartbook. Feb, 2009. [Accessed: September 14, 2010]. Available at: www
.allhealth.org/briefingmaterials /CancerandMedicareChartbookFinalfulldocumentMarch11-1412.pdf. - 5.
- Bach PB. Limits on Medicare’s ability to control rising spending on cancer drugs. N Engl J Med. 2009;360:626–33. [PubMed: 19176475]
- 6.
- Ketcham M, Varghese A. Top 100 drugs by utilization and class variations in generic dispensing rates. Presented at: Medicare Prescription Drug Benefit Symposium; October 30, 2008; Baltimore, Maryland.
- 7.
- Ketcham M, Qu L. Part D utilization and cost trends. Presented at: Part D Data Symposium; March 18, 2010; Baltimore, Maryland.
- 8.
- Liang S, Haas JS, Phillips KA. Medicare formulary coverage for top-selling biologics. Nat Biotechnol. 2009;27(12):1082–4. [PMC free article: PMC2845541] [PubMed: 20010576]
- 9.
- Boyle RM. The use of biologics in cancer therapy. US Pharmacist. 2010;35(3):4–7.
- 10.
- Ma WW, Adjel AA. Novel agents on the horizon for cancer therapy. CA Cancer J Clin. 2009;59:111–137. [PubMed: 19278961]
- 11.
- Cohen M, Marrow T, Penna P. Managing the expanded use of biologics across therapeutic areas: an example from B-cell targeted therapies. Am J Manag Care. 2006;12(2 suppl):S24–S37. [PubMed: 16551202]
- 12.
- AARP Public Policy Institute. Biologics in perspective: expanded clinical options amid greater cost scrutiny. [Accessed September 14, 2010]. Available at: wwwaarporg
/health/drugs-supplements /info-2007 /fs136_biologicshtml. - 13.
- Express Scripts Inc. Biotech drug spending increases 21 percent even as growth in rx expenditure slows, Press release. 2007. [Accessed: September 14, 2010]. Available at: phx
.corporate-ir.net/phoenix .zhtml?c=69641&p =irol-newsArticle&ID =989907&highlight=
Acknowledgments
The authors wish to thank Drs. David Hsia and William Lawrence for their critical review of this brief, Dr. Sean Hennessy for his oversight and guidance, Ms. Mary A. Leonard and Ms. Doreen Bonnett for their graphic design expertise, and Mr. Edmund Weisberg for his medical editing expertise.
This project was funded under Contract No. HHSA29020050041I from the Agency for Healthcare Research and Quality, U.S. Department of Health and Human Services, as part of the Developing Evidence to Inform Decisions about Effectiveness (DEcIDE) program. The authors of this report are responsible for its content. Statements in the report should not be construed as endorsement by the Agency for Healthcare Research and Quality or the U.S. Department of Health and Human Services.
Footnotes
- **
Ranges for the first three quartiles represent values starting from and including the lower number and up to, but not including, the higher number. The fourth quartile range represents values up to and including the higher number.
- *
Dr. Sun has consulted for Genentech and Roche and has a research grant from Amgen.
Suggested Citation: Leonard CE, Freeman CP, MaCurdy T, et al. Utilization and cost of anticancer biologic products among Medicare beneficiaries, 2006–2009. Anticancer Biologics. Data Points #6 (prepared by the University of Pennsylvania DEcIDE Center under contract no. HHSA29020050041I). Rockville, MD: Agency for Healthcare Research and Quality. 2011. AHRQ Publication No. AHRQ 11-EHC002-EF.
- Pharmacotherapy for neovascular age-related macular degeneration: an analysis of the 100% 2008 medicare fee-for-service part B claims file.[Am J Ophthalmol. 2011]Pharmacotherapy for neovascular age-related macular degeneration: an analysis of the 100% 2008 medicare fee-for-service part B claims file.Brechner RJ, Rosenfeld PJ, Babish JD, Caplan S. Am J Ophthalmol. 2011 May; 151(5):887-895.e1. Epub 2011 Feb 18.
- Health care resource utilization and burden of disease in a U.S. Medicare population with a principal diagnosis of osteoarthritis of the knee.[J Med Econ. 2020]Health care resource utilization and burden of disease in a U.S. Medicare population with a principal diagnosis of osteoarthritis of the knee.Chen F, Su W, Bedenbaugh AV, Oruc A. J Med Econ. 2020 Oct; 23(10):1151-1158. Epub 2020 Aug 13.
- Association of Dermatologist Density With the Volume and Costs of Dermatology Procedures Among Medicare Beneficiaries.[JAMA Dermatol. 2018]Association of Dermatologist Density With the Volume and Costs of Dermatology Procedures Among Medicare Beneficiaries.Tan SY, Tsoucas D, Mostaghimi A. JAMA Dermatol. 2018 Jan 1; 154(1):73-76.
- Review Patient financial responsibility for observation care.[J Hosp Med. 2015]Review Patient financial responsibility for observation care.Kangovi S, Cafardi SG, Smith RA, Kulkarni R, Grande D. J Hosp Med. 2015 Nov; 10(11):718-23. Epub 2015 Aug 20.
- Review Prevalence and Medicare reimbursement by recurrent international classification of diseases categories, 2006–2009.[Data Points Publication Series...]Review Prevalence and Medicare reimbursement by recurrent international classification of diseases categories, 2006–2009.Leonard CE, Freeman CP, MaCurdy T, Umscheid CA, de Nava KL, Molina T, MaCurdy S, Kang-Yi CD, Razzaghi H, Hsia D. Data Points Publication Series. 2011
- Utilization and cost of anticancer biologic products among Medicare beneficiarie...Utilization and cost of anticancer biologic products among Medicare beneficiaries, 2006–2009 - Data Points Publication Series
Your browsing activity is empty.
Activity recording is turned off.
See more...