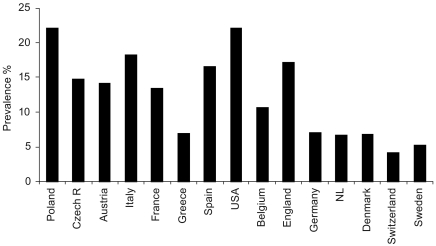
Bar graph showing proportion of adults age 50 or older who report no moderate or vigorous physical activity.

FIGURE 7-3Proportion of adults age 50 or older who report no moderate or vigorous physical activity

NOTE: NL = the Netherlands.

SOURCES: Analyses conducted by the authors based on microdata from Survey of Health, Ageing and Retirement in Europe (SHARE) (see http://www.share-project.org/ [accessed June 2010]) Wave 2, English Longitudinal Study of Ageing (ELSA) (see http://www.ifs.org.uk/elsa/ [accessed June 2010]) Wave 2, and Health and Retirement Study 2004 (see http://hrsonline.isr.umich.edu/ [accessed June 2010]).

From: 7, The Contribution of Physical Activity to Divergent Trends in Longevity

Cover of International Differences in Mortality at Older Ages
International Differences in Mortality at Older Ages: Dimensions and Sources.
National Research Council (US) Panel on Understanding Divergent Trends in Longevity in High-Income Countries; Crimmins EM, Preston SH, Cohen B, editors.
Washington (DC): National Academies Press (US); 2010.
Copyright © 2010, National Academy of Sciences.

NCBI Bookshelf. A service of the National Library of Medicine, National Institutes of Health.