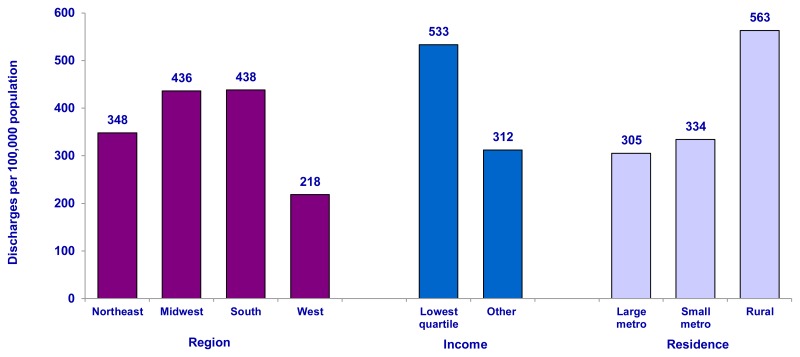
Bar chart; discharges per 100,000 population; by region; Northeast, 348; Midwest, 436; South, 438; West, 218. By income; lowest quartile, 533; other, 312. By residence; large metro, 305; small metro, 334; rural, 563.

Figure 2Acute exacerbation discharges per 100,000 population by patient’s region, income, and residence

Source: AHRQ, Center for Delivery, Organization, and Markets, Healthcare Cost and Utilization Project, Nationwide Inpatient Sample (NIS), 2008

Note: Denominator data for rates were based on Claritas Population Estimates, 2008

From: Statistical Brief #106, Overview of Hospitalizations among Patients with COPD, 2008
Cover of Healthcare Cost and Utilization Project (HCUP) Statistical Briefs
Healthcare Cost and Utilization Project (HCUP) Statistical Briefs [Internet].

NCBI Bookshelf. A service of the National Library of Medicine, National Institutes of Health.