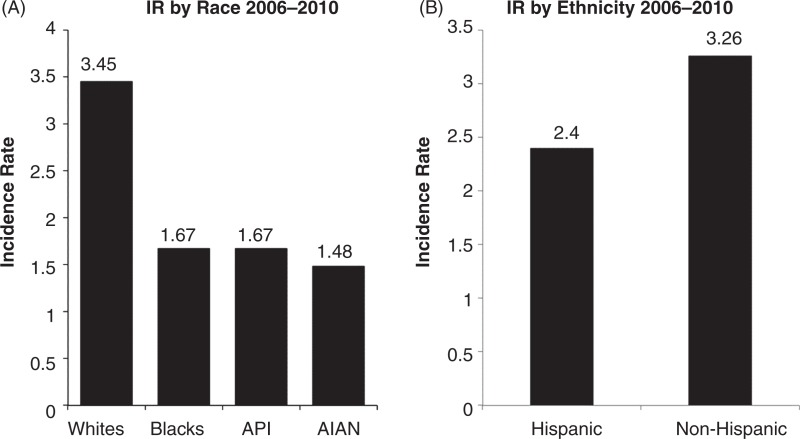
Figure 2. (A) Average annual age-adjusted incidence rates of glioblastoma by race, CBTRUS statistical report: NPCR and SEER, 2006 to 2010.

Figure 2

(A) Average annual age-adjusted incidence rates of glioblastoma by race, CBTRUS statistical report: NPCR and SEER, 2006 to 2010. X-axis, race; Y-axis, incidence rates. (B) Average annual age-adjusted incidence rates of glioblastoma by ethnicity, CBTRUS statistical report: NPCR and SEER, 2006 to 2010. X-axis, ethnicity; Y-axis, incidence rates. Rates are per 100,000. AIAN, Asian Indian Alaskan Native. (Adapted from Ref. (11).)

From: Chapter 8, Epidemiology and Outcome of Glioblastoma

Cover of Glioblastoma
Glioblastoma [Internet].
De Vleeschouwer S, editor.
Brisbane (AU): Codon Publications; 2017 Sep 27.
Copyright: The Authors.

Licence: This open access article is licenced under Creative Commons Attribution 4.0 International (CC BY 4.0). https://creativecommons.org/licenses/by-nc/4.0/

NCBI Bookshelf. A service of the National Library of Medicine, National Institutes of Health.