From: Chapter 5, Chronic Recordings in Transgenic Mice

NCBI Bookshelf. A service of the National Library of Medicine, National Institutes of Health.

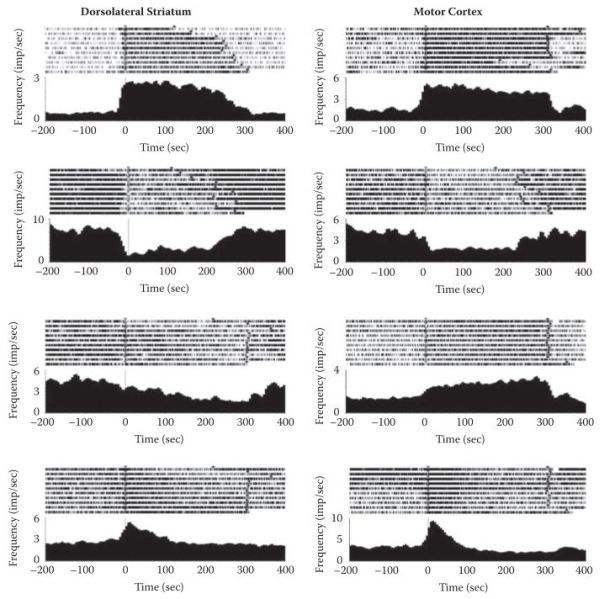
Modulation of neural activity during running on the accelerating rotarod. Left column: striatal neurons, right column: motor cortex neurons. Each panel displays the raster plots and corresponding peri-event time histogram (PETHs) for a particular neuron throughout one session. The beginning of each running period is aligned at time zero. In each graph, trials are presented top to bottom as they were presented during training. Dorsal striatum neurons are presented on the left column and motor cortex neurons on the right column. First row: Example of a striatal and a cortical neuron that abruptly increase their firing rate during the running period. Second row: Example of a striatal and a cortical neuron that abruptly decrease their firing rate during the running period. Third row, left: Example of a striatal neuron with a rather high firing rate at the onset of each trial; gradually decreases firing rate toward the end of the trial. Third row, right: Example of a cortical neuron that gradually increases its firing rate during the running period. Fourth row: Example of a striatal and a cortical neuron that transiently changed their firing rate at the beginning of the running period and then gradually decreased it throughout the trial.
From: Chapter 5, Chronic Recordings in Transgenic Mice

NCBI Bookshelf. A service of the National Library of Medicine, National Institutes of Health.