

NCBI Bookshelf. A service of the National Library of Medicine, National Institutes of Health.
Committee on the Design and Evaluation of Safer Chemical Substitutions: A Framework to Inform Government and Industry Decision; Board on Chemical Sciences and Technology; Board on Environmental Studies and Toxicology; Division on Earth and Life Studies; National Research Council. A Framework to Guide Selection of Chemical Alternatives. Washington (DC): National Academies Press (US); 2014 Oct 29.
A Framework to Guide Selection of Chemical Alternatives.
Show detailsThis chapter begins with general background on ecotoxicology and then briefly reviews current approaches for comparative ecotoxicity assessments that are used in several alternatives assessment frameworks (see Appendix B for a more detailed description of approaches used in the alternatives assessment frameworks considered by the committee). The details behind the committee's framework concerning ecotoxicity assessment (Step 6.2) are then presented (Step 6.2, see Figure 7-1). Box 7-1 outlines the elements of the committee's suggested unified approach. Methods that could be used in ecotoxicity assessment are then discussed. Near-term and aspirational improvements, such as the use of adverse outcome pathways based on in vitro high throughput data and in silico read-across methods, are considered.
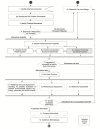
FIGURE 7-1
Committee's framework with the ecotoxicity assessment highlighted.
ECOTOXICOLOGY
Ecotoxicology is the study of how chemicals interact with organisms in the environment. Environments that are potentially at risk vary greatly and include marine and freshwater environments, terrestrial environments from the arctic to the tropics, and even the air where respiratory exposures and foliar uptake by plants can occur. Organisms at risk from chemical exposures include plants, fungi, and algae (primary producers); invertebrates (such as worms, bugs, beetles, and mollusks); fish; amphibians; reptiles; birds; and mammals.
There are an astonishing number of organisms in the world, representing close to 6.5 million species on land and another 2.2 million species in the oceans (Mora et al. 2011). Given this wide range of biodiversity, it is impossible to know everything about the potential ecotoxicological effects of chemicals. Instead, ecotoxicologists rely on a small set of indicator organisms and an understanding of how the physicochemical properties of compounds cause them to partition in the environment and organisms. Those model systems and approaches have provided toxicologists with a surprisingly robust ability to predict the relative hazard of different substances. Because the stated goals of most environmental assessments are primarily on the preservation of species and populations and less with individual organisms (with the exception of large charismatic species, such as bears, mountain lions, and most birds), the end points used most often in hazard assessments are survival and reproduction, with growth included as a surrogate for reproductive fitness in many species.
The ecotoxicology literature is heavily weighted toward aquatic systems, particularly freshwater organisms, because of the historical and ongoing use of water bodies for the discharge of various waste streams. However, land application of sludge, landfills, and terrestrial-based activities (such as mining, refining, and transportation), and air deposition can result in contaminated soils. Relative chemical hazards to terrestrial organisms do not necessarily follow the same patterns as that seen with aquatic organisms, necessitating separate testing and assessment schemes. Toxicity tests with plants and soil invertebrates are becoming more commonplace, thus reducing reliance on extrapolations from aquatic toxicity tests. In contrast, monetary and ethical considerations make it more difficult to conduct toxicity tests on terrestrial vertebrates.
Hazard classification schemes for environmental and ecotoxicological effects also include estimating the amount of bioaccumulation of a chemical within the food web and its persistence in the environment. These two attributes affect the amount and duration of environmental exposure and help predict which organisms are most likely to be affected (primary producers, invertebrates, or top predators). Those intrinsic chemical properties are discussed in more detail in Chapter 5.
ECOTOXICITY ASSESSMENT IN OTHER FRAMEWORKS
The committee considered how ecotoxicity was evaluated by the frameworks that it reviewed (see Chapter 2 and Appendix B). The goal of its analysis was to identify commonalities and distinct differences among the approaches for incorporating those hazards into the frameworks. In the context of this review, ecotoxicity characterizes potential adverse effects that a chemical causes to an aquatic or terrestrial receptor. That definition is used in various assessment methods, including many of the reviewed frameworks. Ecotoxicity is based on the toxicological properties of the chemical and the susceptibility of the organism. Ecotoxicity is distinguished from environmental hazards, which refer to potential adverse effects of the chemical that occur on larger (often geological or meteorological) spatial or temporal scales, such as global warming, ozone depletion, depletion of resources, or effects on indicators of sustainability. As noted above, the committee focused on ecotoxicity in this chapter.
The committee found that the frameworks display varying levels of specificity concerning the assessment of ecotoxicity. Some frameworks have protocols that reference analytical tools or methods that can achieve the ecological evaluations necessary for the relative ranking of chemical alternatives. Most of the protocols do not recommend any particular tool or even under what conditions one tool might be superior to another. Instead, the protocols provide comprehensive lists of methods, tools, and resources that the assessor might use within the context of the framework. Assessors are left to their own discretion in making a selection from among the often long lists of evaluative tools.
Other frameworks specify analytical tools that characterize the potential toxicity of a chemical's persistence, bioaccumulative properties, or environmental mobility through the use of compendia of such data or the application of extrapolations from molecular structure or measured properties. These frameworks usually develop relative rankings of alternatives on the basis of some color-coded system (such as red is more problematic than green) or a narrative classification (such as persistent, very persistent, and not persistent).
Table 7-1 summarizes the aquatic toxicity end points characterized in each framework that provides an analytical system for assessing aquatic and terrestrial hazards. As noted in the table, Design for Environment (DfE) characterizes acute aquatic toxicity on the basis of the concentration at which 50% of the organisms are affected (EC50) or survive treatment (LC50) Chronic toxicity is based on a no observed effect concentration (NOEC) or a lowest observed effect concentration (LOEC) over a series of treatments. The Interstate Chemicals Clearinghouse (IC2) framework also characterizes acute aquatic toxicity on the basis of EC50 or LC50 for tests of specific time frames. It does not provide a chronic aquatic toxicity characterization at early hazard assessment levels, but incorporates the DfE benchmarks through the application of GreenScreen® at later levels. The Toxics Use Reduction Institute (TURI) framework suggests using the Pollution Prevention Options Assessment System (P2OASys) tool, which includes four unequal ranges of LC50 test results for aquatic toxicity and aquatic plant toxicity separately.
TABLE 7-1
Aquatic Toxicity End Points, Thresholds, and Categories Used in Alternatives Assessment Frameworks.
This Pollution Prevention Options Assessment System only characterizes chronic aquatic toxicity for fish. The Guide on Sustainable Development only characterizes aquatic toxicity, with a cutoff based on a NOEC of less than 0.01 mg/L (considered nontoxic). The committee notes that the frameworks generally reference the United Nations Globally Harmonized System of Classification and Labelling of Chemicals (GHS) to characterize aquatic toxicity. Thus, there is little difference in characterizing and ranking aquatic toxicity among the frameworks; they all depend on the same underlying tool, the GHS, as the basis of characterization.
Only the DfE provides a characterization of terrestrial hazards, which is based partly on the EPA Office of Pesticide Programs' “Ecotoxicity Categories for Terrestrial and Aquatic Organisms” (EPA 2014f). The system categorizes avian acute and chronic toxicity, acute toxicity for wild mammals, and toxicity for insect pollinators (see Table 7-2).
TABLE 7-2
DfE Ecotoxicity Categories for Terrestrial and Aquatic Organisms.
Overall, the frameworks provide relative ranks with an underlying assumption that execution of the framework will allow the user to select the safer chemical through a one-to-one comparison. The frameworks are not intended to identify a “safe” alternative per se, but rather evaluate whether the alternative is safer than the chemical of concern. In some cases, the safer alternative may have appreciable hazards that need to be considered.
COMMITTEE'S FRAMEWORK FOR ECOTOXICITY ASSESSMENT
The elements that the committee suggests for evaluating ecotoxicity are shown in Box 7-1. Once the appropriate environmental compartments have been identified using data on physicochemical properties (Chapter 5), ecotoxicity information for organisms associated with those compartments is assembled and compared. Unlike the existing frameworks, the committee's framework allows the analyst to focus on gathering ecotoxicity data for the ecosystem (aquatic, sedimentary [freshwater or marine], or terrestrial) of concern. Current comparative hazard schemes are solely based on aquatic toxicity because of the large database of information. Aquatic toxicity tests are highly standardized, relatively straightforward to conduct, and have been in use for decades. Standardized sediment toxicity tests are available for a few organisms, but differences in bioavailability and organism survival in different sediment types complicates the testing methods and data interpretation (ECHA 2012, 2014d). Soil testing has become more prevalent, particularly with soil invertebrates and microbial function tests, and standard soils for comparative toxicity testing are well established. Higher order terrestrial organism tests with plants and vertebrate animals are more difficult to conduct and therefore data are less prevalent. However, high throughput in vitro studies coupled with adverse outcome pathways (AOP) appropriately predictive for species other than humans may be used in the future as a substitute for hazard comparisons or provide a basis for extrapolating aquatic toxicity data to other species.
The steepness of the slope of the concentration-response curves from the toxicity tests could also be considered in the assessment. Under certain exposure conditions, a steeper slope could indicate a greater hazard potential, as a small increment in chemical concentration will result in a large increased effect, whereas a shallow slope indicates that a greater amount of chemical in the environment may not substantially increase the effect level.
The analyst should gather all available data for the environmental compartment of concern, with no a priori prioritization of particular species (invertebrates vs .vertebrates vs. plants). Toxicity should then be categorized for each end point as low, medium, or high. For the purposes of chemical substitution, it is not necessary to be precise in such comparisons; the goal is to choose a chemical that has substantially less potential hazard, and the variability in the measurement end points across various species tests precludes precise comparisons. Cutoff values that could be used to help to categorize toxicity are shown in Table 7-2. Users of the committee's framework will need to exercise professional judgment since cutoffs in classification tools could result in the assignment of alternatives to different hazard categories (e.g., high vs. medium), when the actual difference in response can be toxicologically insignificant. In addition to categorizing toxicity for each end point, some indication (such as high, medium, or low) should be provided about the uncertainty associated with each categorization. These evaluations can be summarized in a table using a color-coded scheme. A narrative description of the data should be included (for example, if in vivo data are not available, how robust are the conclusions based on read-across, quantitative structure activity relationship [QSAR], in vitro, or other methods).
Visualization/Toxicological Priority Index (ToxPi)
One approach to visualizing the available data is to use the Visualization/Toxicological Priority Index (ToxPi) visualization software, which is illustrated in Figure 7-2 (Reif et al. 2010; see Appendix C for additional information about ToxPi as well as discussions in Chapters 8, 9 and 12.). The “ToxPi visualization” is a visual representation of the relative magnitudes of the hazards (e.g., aquatic, sediment, and terrestrial). The width (in radians) of each slice represents the number of end points in each category, while the length of the slice indicates the overall degree of hazard. The distance of the slice from the origin (i.e., the radius) represents the potency (i.e., the distance from the origin is normalized to the maximum toxicity value; each equivalent is divided by the maximum, and the resulting values are summed). The aquatic, terrestrial, or sediment slices of the pie could be divided further if there are multiple endpoints represented (e.g., test end points such as mortality, growth, or species groups, such as invertebrate, vertebrate, or plant). Toxicity ranking based on high throughput suborganismal tests could be also included as a separate slice, with data normalized to the highest response value, as is done in the other slices. ToxPi describing ecotoxicity data can be displayed for each chemical under consideration, thus allowing for transparent comparisons across chemicals. Relative ranks for inherent hazards to aquatic organisms vs. sediment organisms vs. terrestrial organisms can be quickly visualized in this manner, or converted to ToxPi scores if desired, to aid in policy-dependent trade-offs of hazards to different ecosystems. The ranking of the compounds under consideration, accompanied by the confidence intervals (see Appendix C), can also be easily constructed to communicate the decisions made in the alternatives assessment. Ultimately, the ecotoxicity data may be combined with other available information (e.g., human health hazard, exposure, etc.) using ToxPi or other approaches.

FIGURE 7-2
Illustrative ToxPi showing relative hazard to aquatic (dark blue), sediment (green), and terrestrial (red) organisms. Degree of persistence (orange) and bioaccumulation (light blue) are also shown here.
METHODS FOR HAZARD DETERMINATION
Various methods can be used to obtain the data needed for the ecotoxicity assessment. The following sections briefly discuss the various methods.
Bioassays
Results of toxicity tests for aquatic, sediment, and soil or terrestrial organisms form the basis of most regulatory schemes for chemical registration or transportation, such as those for REACH and GHS. Primary measurement end points for acute and chronic exposures are survival, growth, and reproduction. As noted in Table 7-3, aquatic bioassays include water column (Daphnia; fish—freshwater and marine), sediment (Chironomus, Hyalella, oyster), and amphibians (FETAX; Frog thyroid assay).
TABLE 7-3
Standardized Aquatic Tests for Ecotoxicity Properties.
Terrestrial assays include standardized studies for germination and growth of plants, various types of soft- and hard-bodied soil invertebrates, honeybees, and birds (see Table 7-4). Hazard determination for terrestrial mammals relies on data generated for human health assessments (primarily rodents, but some dog and nonhuman primate studies). Additional data might be available from livestock testing, although that testing is mostly limited to pesticides and pharmaceuticals. Soil microbial function tests are also available to determine chemical effects on respiration, decomposition, and nitrogen fixation. In general, information for toxicity to terrestrial organisms is sparse.
TABLE 7-4
Standardized Terrestrial Tests for Ecotoxicity Properties.
In Silico Estimates of Ecotoxicological Hazard
Advances in in silico prediction methods through computational toxicology, computational chemistry and mechanistic toxicology often permit estimates to be made for untested chemicals, thus allowing data gaps to be filled. This approach is especially useful for an alternatives assessment, where a comparison between two or more chemicals is required. This section describes the in silico models used most commonly to fill such data gaps for ecotoxicology. Although there are a number of in silico approaches that can be used to fill ecotoxicity data gaps, challenges with accuracy and sensitivity of predictions remain.
Chemical Categories Approach, or “Read-Across”
One strategy for filling data gaps for a chemical of concern or alternative is evaluating hazard data pertaining to one or more structurally similar surrogates. According to the OECD guidelines (OECD 2007), this process is accomplished by grouping chemicals into “chemical categories,” which consist of chemicals that share a similar chemical structure or have physicochemical, toxicological, ecotoxicological, or environmental fate properties in common. As a result, it is assumed they are likely to have similar ecotoxicological hazards (see Figure 7-3).
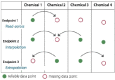
FIGURE 7-3
Schematic representation of the use of chemical categories to fill data gaps, enabling read-across from a data-rich chemical. SOURCE: Adapted from Worth (2008).
The validity of this assertion, however, rests on how a “chemical category” is defined. The guidelines identified by EPA (2010a) and OECD (OECD 2007) for such groupings include the presence of common chemical functional groups, common breakdown products that might result in structurally similar chemicals, or common chemical classes or categories. The potential advantage of the approach is that it allows multiple chemicals to be assessed when only a few analogs have been tested, saving animals and costs. However, the major drawback is that the implied assumption that structural (and property) similarity is sufficient to impart comparative biological activity does not always hold, especially if the grouping rests only on structural similarity. Examples where the assumption does not hold can be found in the pharmaceutical industry, where a minor structural modification of an active pharmaceutical can result in order of magnitude differences in biological activity. If similarities in physicochemical properties are also a required criterion, the probability that chemicals in the same group will have similar biological activity will be increased; however, it is imperative that the properties used are mechanistically linked to the toxicity end point being predicted (see Chapter 5). Finally, the similarity within the category should be justified using a common mechanism or mode of action. The most widely used predictive tool for ecotoxicity using chemical categories is the OECD toolbox (OECD 2012b).
Quantitative Structure Activity Relationships (QSARs)
QSAR models provide estimates of a variety of ecotoxicity end points on the basis of chemical structure. Development of QSAR models for estimating ecotoxicity from chemical structures has advanced considerably (Cronin 2010; Hewitt et al. 2010). There are a number of QSAR tools that allow for a quick estimation of ecotoxicity and can be used by a non-expert. However, the resulting output can be misleading if the user is not trained in the appropriate application of such models. The major tools typically used are:
- Toxicity Estimation Software Tool (TEST) (EPA 2014g).
- Ecological Structure–Activity Relationships (ECOSAR) (aquatic toxicity) (EPA 2014h) based on structural fragments and logP. Validating ECOSAR for three “valid” classes results in predictivity of at least 64%.
- OECD QSAR Toolbox (OECD 2012b).
There are several sets of criteria that can be used to assess the robustness of the QSAR models being used. The Setubal principles (Jaworska et al 2003) require a mechanistic basis, the availability of a training set, and validation. The OECD principles of validation require QSAR models to “have a defined end point, an unambiguous algorithm, a defined domain of applicability, appropriate measures of goodness-of–fit, robustness and predictability, and a mechanistic interpretation whenever possible” (Judson 2009). It is important to note that even the predictive ability of QSARs that meet the above criteria can be hindered by model training issues, such as domain applicability, overtraining, model bias, chance correlation, and overreliance on such testing methods as cross-validation.
In summary, QSAR models that are developed diligently and in keeping with established criteria for robustness can provide accurate predictions of ecotoxicity end points, if used astutely. However, they typically cannot be used to qualitatively assess whether a particular structural modification will result in a different toxicity profile.
Emerging Tools for Assessment of Ecotoxicity
There are several emerging tools that might eventually be valuable for assessing ecotoxicity and are discussed below. However, much research will most likely be needed before these methods can be incorporated confidently into alternatives assessment frameworks.
High Throughput Assays
The search for high throughput methods to predict toxicity to people has resulted in data generation that is directly relevant to the soil compartment. Caenorhabditis elegans is a small (about 1 mm long), free-living transparent nematode that lives in the soil in temperate regions. Its genome has been completely sequenced and the developmental fate of each cell is well known. C. elegans has been used for several decades as a model organism for many systems, including aging, neurobiology, and cellular differentiation, among others. Recently, it has emerged as a model for high throughput toxicological screens, including screening for genetic and molecular targets of new chemicals (Leung et al. 2008). Viability and behavior (such as locomotor activity) also are frequently reported. Such data could be added to information from standard test species of soil invertebrates (Eisinia foetida, Folsomia candida, and Enchytraeus albidus) to increase the range of data for assessing hazard to terrestrial systems.
The zebrafish (Danio rerio) is another species that is now being used in high throughput screening for chemicals. The embryo-larval bioassay was developed for use in preclinical screening of drugs because it is possible to visualize embryo development and there is a short time frame (4 days) from egg production to hatching (Fraysse et al. 2006). This test could provide a useful substitute for the longer fish reproduction studies traditionally conducted with rainbow trout (Oncorhynchus mykiss) and fathead minnow (Pimephales promelas). However, further comparisons of relative sensitivity of zebrafish with the standard test species need to be done before widespread acceptance of the data for predicting effects to aquatic organisms.
In vitro toxicity tests being developed as part of high throughput screening might also have application beyond human health (see Chapter 8) to inform users about potential adverse outcome pathways (AOPs) for other species. For example, EPA's ToxCast™ program has screened compounds using more than 700 biochemical- and cell-based assays (Kavlock et al. 2012). Although many cellular and subcellular systems are conserved across species, care must be taken when conducting cross-species extrapolations of AOPs to focus on commonalities in physiology and be aware of interspecies differences. Even some biological systems that are apparently well conserved across phyla can have differential sensitivities or outcomes depending on the chemical and species. For example, the endocrine system, including hormones and associated cellular receptors, is well conserved among vertebrates, but the same hormone might result in different outcomes, and receptor-binding affinities of a chemical will differ across species because of structural differences of the estrogen receptor. Rainbow trout estrogen receptors, for example, share only a 60% homology with the human estrogen receptor and have a 10-fold lower binding affinity for 17β-estradiol (Fairbrother 2000; Matthews et al. 2000). Furthermore, estrogen has different effects among the various classes of animals, suggesting that estrogenic chemicals would also result in different adverse outcomes. Oviparous (egg-laying) animals, for example, rely on estrogen for shell gland formation and oviduct development and the production of vitellogenin for deposition into the eggs; these are not seen in non-oviparous animals. Similarly, estrogen induces ovulation in mammals and fish, but not in birds, reptiles, amphibians, or invertebrates (Lange et al. 2002).
Prolactin is another hormone found in both mammals and birds, with different regulatory processes in each species. In mammals, it regulates lactation, while in birds, it induces broodiness and nesting. Some receptors and detoxification enzymes, such as the aryl hydrocarbon (Ah) receptors and cytochrome enzymes, seem to be more universal, while others, although nearly universal, have significantly different structures across species (for example, metallothionein). Oxidative stress and formation of free radicals is a common response to some toxicants, including many nanomaterials, and all cells (animal or plant) are responsive to subsequent changes in membrane permeability, gene activation, and enzyme activity. Huggett et al. (2003) summarized the receptor and enzyme expression assays that have been developed for fish and proposed a model for extrapolating toxicity end point values from human assays to fish.
ToxCast™ Phase 1 tested more than 300 chemicals, many of which are pesticides with ecotoxicology data available (Kavlock et al. 2012). The data can be used as a “training set” to develop predictive relationships between the ToxCast™ data and biologically relevant ecotoxicity outcomes for aquatic and terrestrial species, including plants. The 700+ chemicals tested in ToxCast™ Phase 2 can then be ranked more effectively for relative ecological hazard (Sipes et al. 2013; Wilson et al. 2014).
Predicting dose-response relationships, however, is difficult even for humans (Chapter 8), and currently is practically impossible to do when extrapolating from human fibroblasts, keratinocytes, or other cells to plant or animal species. Similarly, attempting to predict which organ system might be affected on the basis of cell culture responses is likely also impossible. Nevertheless, information currently available from ToxCast and other high throughput data should be able to at least group chemicals into yes-no categories regarding toxic potential for the different species groups (aquatic vs terrestrial), which would add significantly to hazard predictions, currently based solely on in vivo testing of three aquatic species (a fish, an invertebrate, and an algae). Additionally, in the absence of animal test data, information from the cellular or subcellular tests in ToxCast™ and similar programs can be used in a general hazard categorization and delineation of which system might be most affected. Because of the lack of information for cross-species extrapolation, however, this is not likely to differ from what would be done for human health hazard classification; therefore, the ranking would default to that discussed in Chapter 8 for human health effects. See the Glitazone case study discussed in Chapter 12 for an example on how high throughput data might be applied.
Design Guidelines
Another approach to fill data gaps and identify chemicals of concern is to use a rapid screening tool based on property-based design guidelines. The approach differs from QSAR in that rather than predicting a threshold of toxicity (such as an LC50 value), it predicts the probability that a compound with particular properties will exhibit ecotoxicity above or below a particular threshold. The approach can define both chemicals with a high probability to be highly toxic and those with high probability of being “safe” (that is, having low to no ecotoxicity on the basis of established thresholds). The distinction between such design guidelines and categorical QSAR models is that the latter use complex statistical approaches (such as random forest, neural network, and machine learning) to identify the classification algorithm, which typically renders the relationship between the descriptors and response undecipherable to the user. By contrast, the design guideline approach typically uses two to three mechanistically tied descriptors and a transparent statistical approach to derive the relationship between the descriptors and response variables.
An example of such an approach for acute aquatic toxicity is illustrated in Figure 7-4. By using two properties (one related to bioavailability and one to reactivity), this approach was shown to identify chemicals least likely to be of concern for acute aquatic toxicity (Kostal et al. in press). Compounds in the lowest toxicity category (colored green) are almost entirely confined to the quadrant of the plot defined by boundaries of logDo/w<1.7 and ∆E>6 eV (Kostal et al. in press), where ∆E is the energy gap between the highest occuped molecular orbital and the lowest unoccupied molecular orbital (Hehre et al. 1986). In the Kostal et al. study (in press), only 1% of the compounds in the highest acute aquatic toxicity category (LC50 < 0.0067 mmol/L) are retained after filtering with these property limits.
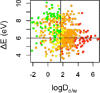
FIGURE 7-4
Scatter plots of the octanol-water distribution coefficient at pH 7.4 (logD7.4) vs. ∆E (LUMO - HOMO energy gap, eV, determined by B3LYP/6-31+G(d)) for 555 compounds tested on 96-h toxicity assay of the fathead minnow. Compounds are colored by (more...)
A similar approach has been developed to identify chemicals of concern or those of no concern for chronic aquatic toxicity (Voutchkova-Kostal et al. 2012). A potential advantage of such methods is that they allow for intuitive comparisons between chemicals and inform the redesign of high-toxicity chemicals. However, a number of potential disadvantages also remain. For example, such approaches do not yield a discrete numerical threshold of toxicity, so if two alternatives are predicted to fall in the same quadrant, it is not possible to distinguish which has lower toxicity.
Quantitative Spectroscopic Data-Activity Relationships (QSDAR)
QSDAR models can provide estimates of ecotoxicity end points using an input of chemical spectra rather than structure (An et al. 2014). The spectroscopic data are used to generate descriptors, which are then fed into a quantitative model to generate a predicted threshold of toxicity. This emerging class of tools has a potential advantage over QSAR models in that it does not require knowledge of exact chemical structure. Therefore, in theory, these tools may be applicable to classes of chemicals, such as surfactants, that are found in mixtures with a variable structure. Thus far, only one example of such a tool exists for acute aquatic toxicity, and it uses nuclear magnetic resonance spectroscopic data (Voutchkova-Kostal et al. 2013). The accuracy of the model is closely comparable to the most robust QSAR models for that end point. However, QSDARs as a class of predictive tools still must undergo much further validation to establish wide applicability domains and the feasibility for estimating ecotoxicity of chemical mixtures.
- Assessment of Ecotoxicity - A Framework to Guide Selection of Chemical Alternati...Assessment of Ecotoxicity - A Framework to Guide Selection of Chemical Alternatives
Your browsing activity is empty.
Activity recording is turned off.
See more...