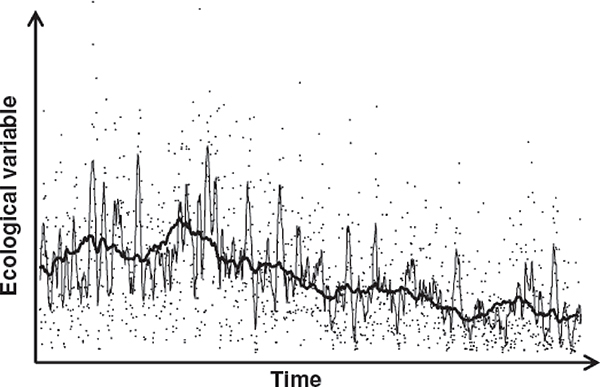
FIGURE 4-1. The intergenerational phenotypic inertia hypothesis.

FIGURE 4-1The intergenerational phenotypic inertia hypothesis

NOTE: Dots represent the fluctuating availability of a hypothetical ecological resource (e.g., nutrition). The two lines are running averages calculated across 10 time units (thin line) and 100 time units (dark line). As the window of averaging increases, an underlying long-term trend is uncovered. It has been hypothesized that the intergenerational influences of maternal and grandmaternal nutritional history on fetal nutrition help achieve a similar feat.

SOURCE: Kuzawa and Quinn (2009), used with permission.

From: 4, The Long Reach of History: Intergenerational and Transgenerational Pathways to Plasticity in Human Longevity

Cover of Sociality, Hierarchy, Health: Comparative Biodemography
Sociality, Hierarchy, Health: Comparative Biodemography: A Collection of Papers.
Committee on Population; Division of Behavioral and Social Sciences and Education; National Research Council; Weinstein M, Lane MA, editors.
Washington (DC): National Academies Press (US); 2014 Sep 22.
Copyright 2014 by the National Academy of Sciences. All rights reserved.

NCBI Bookshelf. A service of the National Library of Medicine, National Institutes of Health.