

NCBI Bookshelf. A service of the National Library of Medicine, National Institutes of Health.
Healthcare Cost and Utilization Project (HCUP) Statistical Briefs [Internet]. Rockville (MD): Agency for Healthcare Research and Quality (US); 2006 Feb-.
Introduction
Patients admitted to the hospital may undergo a variety of treatments, including medical therapy involving administration of medications, diagnostic or therapeutic procedures (such as an X-ray) that occur outside the operating room (OR), and major OR procedures (such as appendectomy). Approximately 15 million hospital stays each year in the United States involve OR procedures.1 On average, hospital stays that involve an OR procedure have been reported to be 2.5 times more costly than stays that do not involve an OR procedure.2
Identifying the volume, characteristics, and costs of OR procedures can help policymakers and researchers better understand population health and facilitate health care improvement efforts. Changes in health care provider payment arrangements and advances in medical practice and technology can impact the nature of the procedures that are performed in hospital operating rooms.3 For example, some less complex surgical procedures, such as cataract surgery, that were once routinely performed in inpatient hospital operating rooms are now primarily performed in the ambulatory surgery setting.4
This Statistical Brief presents data from the Healthcare Cost and Utilization Project (HCUP) on characteristics of OR procedures in 2011. For this Statistical Brief, OR procedures are defined using the HCUP procedure classes tool.5 In this tool, OR procedures are identified based on diagnosis-related groups (DRGs) that use physician panels to determine whether the procedure would be performed in a hospital OR in most hospitals. The findings in this Statistical Brief represent an update to 2007 statistics reported by Elixhauser and Andrews.6 Patient characteristics, resource use, and outcomes are provided for stays with and without OR procedures. The most frequent and most costly OR procedures also are presented. All differences between estimates noted in the text are significant at the .0001 level or better.
Findings
Highlights
- In 2011, hospitalizations that involved operating room (OR) procedures constituted 29 percent of the total 38.6 million hospital stays in the United States and 48 percent of the total $387 billion in hospital costs.
- Hospital stays that involved an OR procedure were about twice as costly as stays that did not involve an OR procedure.
- Compared with hospital stays that did not include an OR procedure, stays involving an OR procedure resulted in a longer length of stay, were more likely to be elective admissions, and were less likely to involve major or extreme severity of illness.
- Hospital stays involving OR procedures were about half as likely to result in patient death as were stays without an OR procedure.
- The 20 most common procedures accounted for more than half of all OR procedures. Cesarean section and circumcision were the most frequent OR procedures. Musculoskeletal procedures and cardiac procedures also accounted for a substantial portion of the most common OR procedures.
- Twenty procedures accounted for more than half of all costs for stays involving OR procedures. Spinal fusion, knee arthroplasty, and percutaneous coronary angioplasty (PTCA) were the procedures with the highest aggregate hospital costs.
Characteristics of hospital stays involving operating room procedures, 2011
In 2011, a total of 38.6 million hospital stays occurred in the United States at an aggregate cost of $387.2 billion. Of these, just over one-fourth of the stays (28.9 percent) and nearly half of the costs (47.9 percent) involved hospitalizations during which OR procedures were performed (Figure 1).
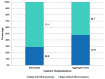
Table 1 presents the patient characteristics for hospital stays with and without OR procedures. The vast majority of these hospital stays occurred among adults aged 20–84 years (81.3% of stays involving OR procedures and 73.1% of stays without OR procedures). Children (aged 0–19 years) and the elderly (aged 85 years and older) were less likely to undergo OR procedures. Females accounted for just over half of hospital stays, with and without an OR procedure. Among hospital stays involving an OR procedure, the most common expected primary payers were private insurance (41.3 percent of stays) and Medicare (34.0 percent). For hospital stays that did not involve an OR procedure, Medicare was the most common primary payer (42.1 percent of stays).
Table 1
Patient characteristics for hospital stays with and without operating room (OR) procedures in U.S. hospitals, 2011.
Overall, hospital stays with OR procedures accounted for $185 billion and stays without OR procedures accounted for $202 billion (Table 2). Hospital stays with OR procedures were twice as expensive as hospital stays without OR procedures in total costs (mean cost of $16,700 versus $7,400 per stay) and cost per day ($3,300 versus $1,700).
Table 2
Resource use and outcomes for hospital stays with and without operating room (OR) procedures in U.S. hospitals, 2011.
Hospital stays involving an OR procedure were longer than stays that did not involve an OR procedure (5.0 versus 4.4 days). Elective hospital admission was more frequent for stays that involved an OR procedure (48.5 percent) than for stays without an OR procedure (13.4 percent).
Hospital stays with an OR procedure were less likely to involve major or extreme severity of illness compared with stays that did not involve an OR procedure (23.7 versus 34.7 percent of stays). Patients with an OR procedure were half as likely to die in the hospital compared with those who did not have an OR procedure (1.1 versus 2.2 percent).
Most frequent and costly types of operating room procedures, 2011
Table 3 provides the top 20 most frequent all-listed OR procedures. Together, these 20 procedures accounted for more than half (54.0 percent) of the 15.7 million OR procedures performed in 2011. Cesarean section and circumcision were the most common OR procedures, accounting for more than 8 percent and 7 percent of all OR procedures, respectively. Five musculoskeletal procedures—knee arthroplasty, laminectomy, spinal fusion, hip replacement, and treatment of hip or lower extremity fracture or dislocation—together accounted for about 17 percent of all OR procedures. Four cardiac procedures—percutaneous coronary angioplasty (PTCA), coronary artery bypass graft (CABG), cardiac device-related procedures, and heart valve procedures—together accounted for another 7 percent of all OR procedures.
Table 3
Most frequent all-listed operating room (OR) procedures performed in U.S. hospitals, 2011.
Table 4 lists the top 20 OR procedures with the highest aggregate hospital costs for the entire hospital stay during which this procedure was first listed on the discharge record. Together, these 20 procedures accounted for more than half (57.5 percent) of all costs associated with stays involving OR procedures and more than one-fourth (26.8 percent) of all hospital costs for stays of any type.
Table 4
Most costly first-listed operating room (OR) procedures performed in U.S. hospitals, 2011.
Six of the top 20 OR procedures with the highest aggregate hospital costs were musculoskeletal procedures: spinal fusion (7.1 percent of aggregate costs for stays with OR procedures), knee arthroplasty (6.3 percent), hip replacement (4.4 percent), treatment of hip fracture (2.4 percent), laminectomy (1.3 percent), and treatment of other lower extremity fracture (1.2 percent).
Four heart-related procedures were among the top 20 OR procedures with the highest aggregate costs: PTCA (5.4 percent of costs for stays with OR procedures), CABG (3.6 percent), heart valve procedures (3.4 percent), and pacemaker/cardioverter/defibrillator procedures (2.2 percent). Among the 20 OR procedures with the highest aggregate hospital costs, heart valve procedures and CABG had the highest mean costs per hospital stay ($53,400 and $38,700, respectively).
Two childbirth and delivery-related procedures (Cesarean section and circumcision) were also in the top 20 OR procedures with the highest aggregate costs, accounting for 4.1 percent and 1.0 percent of costs for stays with OR procedures.
Four gastrointestinal procedures were in the top 20: colorectal resection (3.7 percent of aggregate inpatient costs for stays with OR procedures), cholecystectomy (2.8 percent), appendectomy (1.4 percent), and small bowel resection (1.3 percent).
Data Source
The estimates in this Statistical Brief are based upon data from the Healthcare Cost and Utilization Project (HCUP) 2011 Nationwide Inpatient Sample (NIS). Supplemental sources included population denominator data for use with HCUP databases.7
Many hypothesis tests were conducted for this Statistical Brief. Thus, to decrease the number of false-positive results, we reduced the significance level to .0001 for individual tests.
Definitions
Procedures, ICD-9-CM, and Clinical Classifications Software (CCS)
All-listed procedures include all procedures performed during the hospital stay, whether for definitive treatment or for diagnostic or exploratory purposes. The first-listed procedure is the procedure that is listed first on the discharge record. Inpatient data define this as the “principal procedure”—the procedure that is performed for definitive treatment rather than for diagnostic or exploratory purposes (i.e., the procedure that was necessary to take care of a complication). ICD-9-CM is the International Classification of Diseases, Ninth Revision, Clinical Modification, which assigns numeric codes to procedures. There are about 4,000 ICD-9-CM procedure codes.
CCS categorizes procedure codes into clinically meaningful categories.8 This “clinical grouper” makes it easier to quickly understand patterns of procedure use. CCS categories identified as “Other” typically are not reported; these categories include miscellaneous, otherwise unclassifiable procedures that may be difficult to interpret as a group. In addition, procedure categories that are nonspecific or likely to be adjuncts to other procedures (e.g., excision, lysis peritoneal adhesions; partial bone excision; intraoperative cholangiogram) are not included in the listings of specific procedures in Tables 3 and 4.
Major operating room (OR) procedures were defined using procedure classes, which categorize each ICD-9-CM procedure code as either major therapeutic, major diagnostic, minor therapeutic, or minor diagnostic.9 Major OR procedures are considered to be valid OR procedures based on diagnosis-related groups (DRGs). This classification scheme relies upon physician panels that classify ICD-9-CM procedure codes according to whether the procedure would be performed in a hospital operating room in most hospitals.
Types of hospitals included in HCUP
HCUP is based on data from community hospitals, which are defined as short-term, non-Federal, general, and other hospitals, excluding hospital units of other institutions (e.g., prisons). HCUP data include obstetrics and gynecology, otolaryngology, orthopedic, cancer, pediatric, public, and academic medical hospitals. Excluded are long-term care, rehabilitation, psychiatric, and alcoholism and chemical dependency hospitals. However, if a patient received long-term care, rehabilitation, or treatment for psychiatric or chemical dependency conditions in a community hospital, the discharge record for that stay will be included in the Nationwide Inpatient Sample (NIS).
Unit of analysis
The unit of analysis is the hospital discharge (i.e., the hospital stay), not a person or patient. This means that a person who is admitted to the hospital multiple times in one year will be counted each time as a separate “discharge” from the hospital.
Costs and charges
Total hospital charges were converted to costs using HCUP Cost-to-Charge Ratios based on hospital accounting reports from the Centers for Medicare & Medicaid Services (CMS).10 Costs will reflect the actual expenses incurred in the production of hospital services, such as wages, supplies, and utility costs; charges represent the amount a hospital billed for the case. For each hospital, a hospital-wide cost-to-charge ratio is used. Hospital charges reflect the amount the hospital billed for the entire hospital stay and do not include professional (physician) fees. For the purposes of this Statistical Brief, costs are reported to the nearest hundred.
Aggregate costs are calculated using aggregate charges. Aggregate charges include discharges with missing or invalid charges that are imputed by taking the mean charges for all discharges of the same diagnosis-related group (DRG) with nonmissing charges. Fewer than 2 percent of cases are missing charges in HCUP data. Mean costs are calculated using only discharges with nonmissing and valid charges. Because of the manner in which missing charges are imputed to calculate aggregate charges, simple calculation of the number of discharges multiplied by the mean cost will not always equal the aggregate costs.
Payer
Payer is the expected primary payer for the hospital stay. To make coding uniform across all HCUP data sources, payer combines detailed categories into general groups:
- –
Medicare: includes patients covered by fee-for-service and managed care Medicare
- –
Medicaid: includes patients covered by fee-for-service and managed care Medicaid
- –
Private Insurance: includes Blue Cross, commercial carriers, and private health maintenance organizations (HMOs) and preferred provider organizations (PPOs)
- –
Other: includes Worker's Compensation, TRICARE/CHAMPUS, CHAMPVA, Title V, and other government programs
- –
Uninsured: includes an insurance status of “self-pay” and “no charge.”
Encounters billed to the State Children's Health Insurance Program (SCHIP) may be classified as Medicaid, Private Insurance, or Other, depending on the structure of the State program. Because most State data do not identify SCHIP patients specifically, it is not possible to present this information separately.
When more than one payer is listed for a hospital discharge, the first-listed payer is used.
Patient complexity
Cases with the highest severity of illness are discharges with a score of 3 or 4 on the All Patient Refined DRG (APR-DRG) severity of illness scale. The four severity of illness subclasses are numbered sequentially from 1 to 4 indicating minor, moderate, major, or extreme severity of illness. The determination of severity of illness is disease specific. Thus, the significance attributed to complicating or comorbid conditions is dependent on the underlying problem. For example, certain types of infections are considered a more significant problem in a patient who is immunosuppressed than in a patient with a fractured arm. In APR-DRGs, high severity of illness is primarily determined by the interaction of multiple diseases. Patients with multiple comorbid conditions involving multiple organ systems represent difficult-to-treat patients who tend to have poor outcomes. The assignment of a patient to a severity of illness subclass takes into consideration not only the level of the secondary diagnoses but also the interaction among secondary diagnoses, age, principal diagnosis, and the presence of certain operating room and nonoperating room procedures.
For More Information
For more information about HCUP, visit http://www.hcup-us.ahrq.gov/.
For additional HCUP statistics, visit HCUPnet, our interactive query system, at http://hcupnet.ahrq.gov/.
For information on other hospitalizations in the United States, refer to the following HCUP Statistical Briefs located at http://www.hcup-us.ahrq.gov/reports/statbriefs/statbriefs.jsp:
- Statistical Brief #144, Overview of Hospital Stays in the United States, 2010
- Statistical Brief #146, Costs for Hospital Stays in the United States 2010
- Statistical Brief #148, Most Frequent Conditions in U.S. Hospitals, 2010
- Statistical Brief #149, Most Frequent Procedures Performed in U.S. Hospitals, 2010
For a detailed description of HCUP, more information on the design of the Nationwide Inpatient Sample (NIS), and methods to calculate estimates, please refer to the following publications:
Introduction to the HCUP Nationwide Inpatient Sample, 2009. Online. May 2011. U.S. Agency for Healthcare Research and Quality. http://hcup-us.ahrq.gov/db/nation/nis/NIS_2009_INTRODUCTION.pdf. Accessed November 21, 2013.
Houchens R, Elixhauser A. Final Report on Calculating Nationwide Inpatient Sample (NIS) Variances, 2001. HCUP Methods Series Report #2003-2. Online. June 2005 (revised June 6, 2005). U.S. Agency for Healthcare Research and Quality. http://www.hcup-us.ahrq.qov/reports/CalculatinqNISVariances200106092005.pdf. Accessed November 21, 2013.
Footnotes
- 1
Elixhauser A, Andrews RM. Profile of inpatient operating room procedures in US hospitals in 2007. Arch Surg. 2010 December;145(12):1201–8. [PubMed: 21173295].
- 2
Ibid.
- 3
Cullen KA, Hall MJ, Golosinskiy A. National Health Statistics Reports #11. Hyattsville, MD: Center for Disease Control and Prevention, National Center for Health Statistics; Sep 4, 2009. [November 21, 2013]. Ambulatory Surgery in the United States, 2006. http://www
.cdc.gov/nchs /data/nhsr/nhsr011.pdf. [PubMed: 19294964]. - 4
Ibid.
- 5
HCUP Procedure Classes. Healthcare Cost and Utilization Project (HCUP). Rockville, MD: U.S. Agency for Healthcare Research and Quality; [November 21, 2013]. Updated September 2013. http://www
.hcup-us.ahrq .gov/toolssoftware /procedure/procedure.jsp.. - 6
Elixhauser A, Andrews RM. Profile of inpatient operating room procedures in US hospitals in 2007. Arch Surg. 2010 December;145(12):1201–8. [PubMed: 21173295].
- 7
Barrett M, Lopez-Gonzalez L, Coffey R, Levit K. HCUP Methods Series Report #2013-01. U.S. Agency for Healthcare Research and Quality; Mar 8, 2013. [November 21, 2013]. Population Denominator Data for use with the HCUP Databases (Updated with 2012 Population data). Online. http://www
.hcup-us.ahrq .gov/reports/methods/2013_01.pdf.. - 8
HCUP Clinical Classifications Software (CCS). Healthcare Cost and Utilization Project (HCUP). Rockville, MD: U.S. Agency for Healthcare Research and Quality; [November 21, 2013]. Updated November 2013. http://www
.hcup-us.ahrq .gov/toolssoftware/ccs/ccs.jsp.. - 9
HCUP Procedure Classes. Healthcare Cost and Utilization Project (HCUP). U.S. Agency for Healthcare Research and Quality; Rockville, MD: [November 21, 2013]. Updated September 2013. http://www
.hcup-us.ahrq .qov/toolssoftware /procedure/procedure.jsp.. - 10
HCUP Cost-to-Charge Ratio Files (CCR). Healthcare Cost and Utilization Project (HCUP). Rockville, MD: U.S. Agency for Healthcare Research and Quality; 2001–2009. [November 21, 2013]. Updated September 2012. http://www
.hcup-us.ahrq .gov/db/state/costtocharge.jsp..
About the NIS The HCUP Nationwide Inpatient Sample (NIS) is a nationwide database of hospital inpatient stays. The NIS is nationally representative of all community hospitals (i.e., short-term, non-Federal, nonrehabilitation hospitals). The NIS is a sample of hospitals and includes all patients from each hospital, regardless of payer. It is drawn from a sampling frame that contains hospitals comprising more than 95 percent of all discharges in the United States. The vast size of the NIS allows the study of topics at both the national and regional levels for specific subgroups of patients. In addition, NIS data are standardized across years to facilitate ease of use.
About HCUPnet HCUPnet is an online query system that offers instant access to the largest set of all-payer health care databases publicly available. HCUPnet has an easy step-by-step query system, allowing for tables and graphs to be generated on national and regional statistics as well as trends for community hospitals in the United States. HCUPnet generates statistics using data from HCUP's Nationwide Inpatient Sample (NIS), the Kids' Inpatient Database (KID), the Nationwide Emergency Department Sample (NEDS), the State Inpatient Databases (SID), and the State Emergency Department Databases (SEDD).
Suggested Citation Weiss AJ (Truven Health Analytics), Elixhauser A (AHRQ), Andrews RM (AHRQ). Characteristics of Operating Room Procedures in U.S. Hospitals, 2011. HCUP Statistical Brief #170. February 2014. Agency for Healthcare Research and Quality, Rockville, MD. http://www
.hcup-us.ahrq .qov/reports/statbriefs /sb170-Operatinq-Room-Procedures-United-States-2011 .pdf. Acknowledgments The authors would like to acknowledge the contributions of Ed Hock of Social & Scientific Systems, Inc.
- Review Trends in Operating Room Procedures in U.S. Hospitals, 2001–2011.[Healthcare Cost and Utilizatio...]Review Trends in Operating Room Procedures in U.S. Hospitals, 2001–2011.Weiss AJ, Elixhauser A. Healthcare Cost and Utilization Project (HCUP) Statistical Briefs. 2006 Feb
- Review Most Frequent Operating Room Procedures Performed in U.S. Hospitals, 2003–2012.[Healthcare Cost and Utilizatio...]Review Most Frequent Operating Room Procedures Performed in U.S. Hospitals, 2003–2012.Fingar KR, Stocks C, Weiss AJ, Steiner CA. Healthcare Cost and Utilization Project (HCUP) Statistical Briefs. 2006 Feb
- Review Refinement of the HCUP Quality Indicators[ 2001]Review Refinement of the HCUP Quality IndicatorsDavies SM, Geppert J, McClellan M, McDonald KM, Romano PS, Shojania KG. 2001 May
- Review Most Frequent Procedures Performed in U.S. Hospitals, 2011.[Healthcare Cost and Utilizatio...]Review Most Frequent Procedures Performed in U.S. Hospitals, 2011.Pfuntner A, Wier LM, Stocks C. Healthcare Cost and Utilization Project (HCUP) Statistical Briefs. 2006 Feb
- Review Hospital-Based Ambulatory Surgery, 2007.[Healthcare Cost and Utilizatio...]Review Hospital-Based Ambulatory Surgery, 2007.Russo A, Elixhauser A, Steiner C, Wier L. Healthcare Cost and Utilization Project (HCUP) Statistical Briefs. 2006 Feb
- Characteristics of Operating Room Procedures in U.S. Hospitals, 2011 - Healthcar...Characteristics of Operating Room Procedures in U.S. Hospitals, 2011 - Healthcare Cost and Utilization Project (HCUP) Statistical Briefs
Your browsing activity is empty.
Activity recording is turned off.
See more...