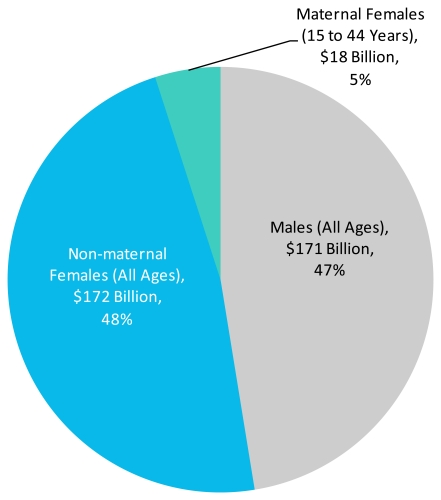
EXHIBIT 5.1 Overview of Female and Male Hospital Stays. 5.1g Distribution of aggregate costs by sex, 2009. Distribution of aggregate costs by sex, 2009. Pie chart. Percent distribution. Males (all ages): $171 billion, 47%. Non-maternal females (all ages): $172 billion, 48%. Maternal females (15 to 44 years): $18 billion, 5%. Source: AHRQ, Center for Delivery, Organization, and Markets, Healthcare Cost and Utilization Project, Nationwide Inpatient Sample, 2009.

Distribution of Aggregate Costs by Sex, 2009

Source: AHRQ, Center for Delivery, Organization, and Markets, Healthcare Cost and Utilization Project, Nationwide Inpatient Sample, 2009.

Download this figure as an MS Excel spreadsheet (26K)

From: WOMEN’S HEALTH

Cover of HCUP Facts and Figures: Statistics on Hospital-Based Care in the United States, 2009
HCUP Facts and Figures: Statistics on Hospital-Based Care in the United States, 2009 [Internet].
Healthcare Cost and Utilization Project (HCUP).

NCBI Bookshelf. A service of the National Library of Medicine, National Institutes of Health.