From: The Eukaryotic Cell Cycle
Copyright © 2000, Geoffrey M Cooper.
NCBI Bookshelf. A service of the National Library of Medicine, National Institutes of Health.
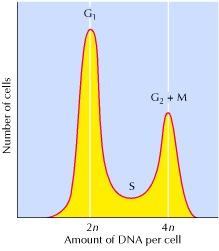
A population of cells is labeled with a fluorescent dye that binds DNA. The cells are then passed through a flow cytometer, which measures the fluorescence intensity of individual cells. The data are plotted as cell number versus fluorescence intensity, which is proportional to DNA content. The distribution shows two peaks, corresponding to cells with DNA contents of 2n and 4n; these cells are in the G1 and G2/M phases of the cycle, respectively. Cells in S phase have DNA contents between 2n and 4n and are distributed between these two peaks.
From: The Eukaryotic Cell Cycle
NCBI Bookshelf. A service of the National Library of Medicine, National Institutes of Health.