NCBI Bookshelf. A service of the National Library of Medicine, National Institutes of Health.
Walker HK, Hall WD, Hurst JW, editors. Clinical Methods: The History, Physical, and Laboratory Examinations. 3rd edition. Boston: Butterworths; 1990.
Definition
Reticulocytes are the erythroid cells in the peripheral blood that are in a discrete, penultimate phase of maturation. The nucleus has been removed, usually before the red cells enter the peripheral blood. However, some of the extranuclear RNA remains. This residual RNA generally is lost progressively during the 24 hours after the cell enters the circulation. Reticulocytes thus represent a distinctive cohort of cells, those most recently entering the peripheral blood. Reticulocytes differ from other red cells in that they have a more convoluted shape, and are about 8% larger than the more mature cells. These latter two distinctions are not so clear-cut as is the presence of residual RNA. With the typical Wright's stain used for routine examination, only the earliest reticulocytes with the most residual RNA will be "polychromatophil" (i.e., more bluish than the mature erythrocytes).
Technique
The standard technique is the "new methylene blue" stain. This stain, routinely done by the clinical hematology laboratory, is designed to highlight the RNA as blue color against an otherwise pink cell. Depending on the stage of the reticulocyte, the blue color may be distributed in a general (early reticulocyte) or punctate (late reticulocyte) pattern. From visual examination of a peripheral blood film so stained, the number of reticulocytes among 1000 erythrocytes is found and expressed as a percentage. This is termed the reticulocyte count.
Basic Science
It is assumed that the normal red cell life span is 120 days and that the duration of a reticulocyte in the peripheral blood is 1 day. It follows that reticulocytes at a random time, in a normal subject at a steady state, will be 1/120, or 0.8% of all red cells. Allowing for a 10% variation in red cell life span would theoretically give a range of 0.7 to 0.9%. However, there is considerable statistical variability when the number of observations is small. Further, there is observer variability in deciding what is positively stained (a minimum of 25% intraobserver and 50% interobserver variation). Therefore, the duplicate error in a given reticulocyte percentage approaches 100% (our normal subjects" reticulocyte percentage varied by an average of 80% among five samples over 2 months). Because some laboratories are more liberal than others about designating cells as reticulocytes, the clinician must know the local normal values and range, and be certain that these represent the laboratory's actual experience rather than values given in a reference book. Our range of normal values is 0.4 to 3.0%.
The reticulocyte percentage in the peripheral blood is an indication of the rapidity of red cell turnover if the patient is in a steady state. However, the number of reticulocytes released into the blood reflects the amount of erythropoiesis on a given day. The absolute number of reticulocytes is determined as the reticulocyte index, or "corrected" reticulocyte count. To determine this, the reticulocyte percentage is adjusted by the ratio of the observed hematocrit to the expected hematocrit, yielding an absolute number of reticulocytes. Sometimes a "second correction" is made. If, subjectively judged, there is pronounced polychromatophilia in the peripheral blood film, it is assumed that younger reticulocytes are disproportionately numerous. Such younger reticulocytes will retain their RNA longer than average, and so they represent a cohort of cells that will be perceived as reticulocytes for longer than 1 day. Their persistence as reticulocytes would give a falsely high percentage of cells as representing a single day's red cell production. The magnitude of the "second correction" tends to parallel the first. For instance, if the reticulocyte count is 10.0% and the hematocrit is 25%, and polychromasia is seen on the slide:
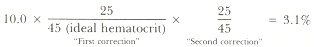
The absolute number of reticulocytes thus would be only about double the normal value.
Because these values duplicate the error of the initial reticulocyte percentage, the error of the absolute reticulocyte number must be at least as great. Further, these "corrections" would be most precise if the patient's own expected hematocrit could be used as the denominator, and if polychromasia could be quantified. Nonetheless, the two values provide complementary data. The percentage is proportional, at least when the value is steady, to the reciprocal of the red cell life span. The absolute number gives the amount of erythropoiesis on a given day. When interpreted as obviously high, substantially normal, or obviously low, each number allows valuable physiologic insight into the causes of anemia. Because of the duplicate error of measurement, however, interpretation of small changes or borderline "abnormal" values should be made with caution.
The correlation between the reticulocyte percentage and the appearance of polychromasia on the peripheral smear is not exact. The normal subject's blood may contain few visible polychromatophilic cells despite, say, 1% reticulocytes (Figure 156.1). Subjects with certain disorders may have a disproportionate number of polychromatophilic cells for the percentage of reticulocytes.
Reticulocytes are said to be large enough to cause an increase in mean cell volume (MCV) if the percentage is markedly elevated. This occurs in only a small group of subjects with very high reticulocyte percentages—those with chronic immune hemolytic anemia. These latter patients are thought to have a "shift" of erythropoiesis, in which a cell division is skipped and cells larger than normal are produced. Otherwise, reticulocytes are only about 8% larger than the red cells into which they mature. Therefore, only in autoimmune hemolytic anemia should increased red cell size (MCV) be attributed to the reticulocytosis.
A new technique for reticulocyte counting is use of flow cytometry. This approach uses a dye that selectively stains RNA, and distinguishes reticulocytes from other RNA-containing cells by another variable such as size. This technique has not yet been widely used, but is under active study at several centers.
Clinical Significance
Four abnormal patterns can be distinguished. As shown in Figure 156.2, these correspond to a physiologically distinct group of diseases. For each there is an analogous group of platelet disorders.
Reduced reticulocyte percentages are seen in bone marrow suppression. Examples include cytotoxic chemotherapy and aplastic anemia (Figure 156.2A). Anemia of chronic disease also is in this category. To be certain that the reticulocyte percentage is abnormally low, a repeat measurement may be necessary because as few as four or five reticulocytes in the thousand cells counted (0.4 to 0.5%) may be within the duplicate error of "normal." When the correction factors are used, the absolute reticulocyte count (percentage adjusted for degree of anemia) may be below normal, even though the percentage is normal. In such cases the bone marrow is not responding appropriately to the anemia and therefore is, in an absolute sense, hypoproliferative. This approach helps to distinguish physiologically those red cell disorders in which the number and/or proliferative activity of the bone marrow erythroid precursors is deficient. However, in practice, because of the limitations described above, there will be a broad "gray zone" in which it is unclear whether the reticulocyte percentage (or count) is normal or not. Hypoplastic thrombocytopenia has a similar basis.
Increased reticulocyte percentages are seen in hemolytic disorders, whether intrinsic (e.g., hemoglobinopathy or enzymopathy) or extrinsic (e.g., traumatic, heart valve, acquired immune hemolytic anemia). As long as the hemolytic cause is not corrected, the reticulocyte count will remain elevated. A particular danger to patients with chronic hemolytic anemia is transient reticulocytopenia from a drug or infection. In the normal subject, marrow hypoplasia for even a week makes little difference because a week's erythropoiesis is only 7/120, or 6%, of the red cell mass. In contrast, the patient with chronic hemolytic anemia and a 20% reticulocyte percentage is making 20% of cells each day. If the cells continue to be destroyed prematurely, even a fall to half of the accustomed hyperproduction could be disastrous. Therefore, the patient with chronic hemolytic anemia (e.g., sickle cell anemia) should have interval reticulocyte counts as well as hemoglobin measured. To the extent that the hemolysis has caused a "shift" of erythropoiesis, the cells will be larger. Also, the more anemia caused by hemolysis, the greater the proportion of polychromatophilic cells (Figure 156.2B). Therefore, an extremely high reticulocyte percentage may represent only a modest increase in absolute erythropoiesis. In these disorders, bone marrow precursors are not only increased in number; they also are altered in their maturation. This is analogous to the changes in platelet production in immune thrombocytopenia.
The reticulocyte percentage is also increased in the recovery from a nutritional anemia (e.g., iron) or the recovery of erythropoiesis after bone marrow suppression (e.g., chemotherapy). If the marrow is normal after the therapy, the degree of reticulocytosis will parallel the degree of anemia. A similar pattern is seen in the acute reticulocytosis following sudden blood loss. As the recovery progresses, the reticulocyte percentage will abate to normal. Usually in these acute marrow responses, there is no "shift" of erythropoiesis. The reticulocyte percentage and number are high, but the proportion of polychromatophilic cells is normal (Figure 156.2C). The number of marrow erythroid cells is increased, but their maturation is normal. This represents a lesser, and perhaps qualitatively different, stimulation of the bone marrow. This is similar to reactive thrombocytosis.
The red cell volume distribution histogram available in many automated blood counters can be valuable. As noted above, when the marrow is normal, the reticulocytes are about 8% larger than the red cells into which they mature. If, after what is thought to be specific therapy, the reticulocytes are abnormal in size (> 105 fl or < 85 fl), the physician should ask what abnormality has been unmasked by the therapy. The most common is a macrocytic disorder (due to chronic liver disease, folate, vitamin B12 deficiency, or cytotoxic chemotherapy) hidden by the low MCV of iron deficiency until iron therapy is begun; or, vice versa, iron deficiency concealed by megaloblastic deficiency.
Thus, a low reticulocyte percentage or count reflects a marrow unable to compensate for anemia. A high reticulocyte percentage or count reflects a marrow that is attempting to compensate for red cell destruction, or recovering from anemia. In between the two clear-cut extremes are those subjects who have reticulocyte percentages within the normal range, including the technologic error. These normal reticulocyte disorders include many cases of nutritional disorders (iron, folate, vitamin B12 deficiency); the confusing spectrum of chronic liver disease and alcohol abuse; leukemias and other marrow infiltrative disorders; and nonanemic hemoglobinopathies such as hemoglobin AS or AC. The differential is long and usually other, more specific tests will be needed to establish a diagnosis in patients with normal reticulocyte values. Adjustment for hematocrit or polychromasia usually is valuable only in cases of marked anemia.
Polychromasia may be increased on the peripheral blood smear even when the reticulocyte count or percentage is normal. This finding suggests the premature release of erythroid cells from a marrow that is not hyperactive. Causes include marrow infiltration by tumor or granulomas, or marrow fibrosis. In these disorders it is presumed that the physiologic or physical barrier keeping immature red cells from the circulation has been compromised. Removal of the spleen will cause little change of this sort if splenectomy is incidental in an otherwise hematologically normal subject. However, in a subject who already has a compromised bone marrow, a larger number of abnormal cells can exist, including immature reticulocytes and nucleated red cells. Removal of the spleen removes a major filter of these cells. Therefore, patients with both splenectomy and marrow replacement or fibrosis can have dramatic polychromasia despite a modest reticulocyte percentage (Figure 156.2D). Similarly, patients with splenectomy or marrow infiltration have abnormally large platelets released.
The percentage of RNA-containing erythrocytes and the amount of RNA per reticulocyte can be combined to allow a classification of red cell disorders (Table 156.1). This will enhance the value of the morphophysiologic classification by the electronic indices mean cell volume and red cell distribution width.
Neither the automated blood count (ABC) nor the reticulocyte count provide definitive specific diagnoses. A characteristic set of ABC and reticulocyte values may suggest a small differential or even one specific disorder. Usually it is then appropriate to select more specialized tests to confirm a definitive diagnosis. For example, anemia with a high reticulocyte percentage suggests hemolysis. Depending on other data, the confirmatory test may be hemoglobin electrophoresis, Coombs" test, etc. Use of the ABC and reticulocyte percentage, both rapid and inexpensive, can focus and speed diagnosis, limiting the number of slower and costlier confirmatory tests.
References
- Bessman JD. Erythropoiesis during recovery from macrocytic anemia: macrocytes, normocytes, and microcytes. Blood. 1977;50:995–1000. [PubMed: 922166]
- Bessman JD. The relation of megakaryocyte ploidy to platelet size. Am J Hematol. 1984;16:161–70. [PubMed: 6538064]
- Davis BH, Bigelow NC. Flow cytometric reticulocyte quantification using thiazole orange provides clinically useful reticulocyte maturity index. Arch Path Lab Med. 1989;113:682–689. [PubMed: 2471489]
- Gilmer PR, Koepke JA. The reticulocyte: an approach to definition. Am J Clin Pathol. 1976;66:262–67. [PubMed: 937270]
- Hillman RS, Finch CA. The misused reticulocyte. Br J Haematol. 1969;17:313–15. [PubMed: 5346405]
- Metzger DK, Charache S. Flow cytometric reticulocyte counting with thioflavin T in a clinical hematology laboratory. Arch Path Lab Med. 1987;111:540–544. [PubMed: 3579511]
- Peebles DA, Hochberg A, Clarke TA. Analysis of manual reticulocyte counting. Am J Clin Pathol. 1981;76:713–17. [PubMed: 7293983]
- Seligman PA, Allen RH, Kirchanski SJ. et al. Automated analysis of reticulocytes using fluorescent staining with both acridine orange and an immunofluorescence technique. Am J Hematol. 1983;14:57–66. [PubMed: 6301264]
- Tanke JH, Rothbarth PH, Vosser JM. et al. Flow cytometry of reticulocytes applied to clinical hematology. Blood. 1983;62:1091–97. [PubMed: 6188505]
- Weiser M, Kociba GJ. Persistent macrocytosis assessed by erythrocyte subpopulation analysis following erythroid regeneration in cats. Blood. 1982;60:295–303. [PubMed: 7093520]
Figures
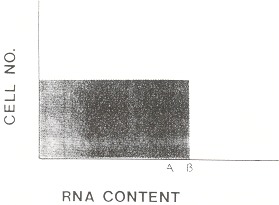
Figure 156.1
Schematic of distribution of RNA among reticulocytes in various disorders. It assumes that reticulocytes are released as a cohort with identical RNA content. This type of pattern will be available clinically when single red cell RNA content can be quantitated by flow cytometry. A is the minimum RNA content for a cell to be recognized as polychromatophilic. B is the RNA content of normal reticulocytes when they are released into the blood. From this value, the cell's RNA content progressively diminishes during the next 24 hours. In the normal person, few cells appear polychromatophilic. The shaded area shows the assumed normal distribution of RNA and is repeated for comparison in Figure 156.2.
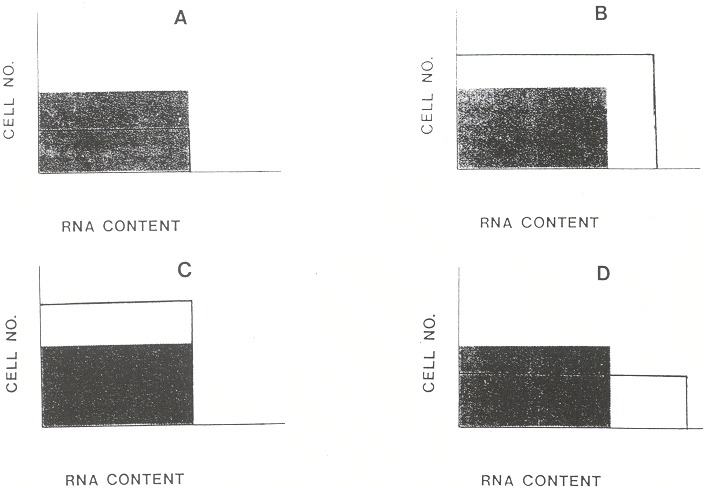
Figure 156.2
Patterns of abnormality. (A) Marrow hypoplasia. There is a reduced number of reticulocytes. The percentage of young reticulocytes with enough RNA to cause polychromatophilia is normal. (B) Chronic hemolytic anemia. The number of reticulocytes is increased. Also, as a "shift" response to anemia the reticulocytes are released earlier from the bone marrow. Earlier release means higher RNA content on release, longer persistence of RNA, and a higher proportion of visibly polychromatophilic cells. (C) Acute marrow response. The reticulocyte percentage is higher, but their distribution of maturation is similar to normal, so relatively few are polychromatophilic. The pattern is typical of marrow recovery from nutritional deficiency, marrow suppression, or blood loss. (D) Marrow infiltration. There is a normal number of reticulocytes, but an increased percentage of prematurely released polychromatophilic cells.
Tables
Table 156.1Physiologic Distinction of Disorders of Erythropoiesis
| Reticulocyte number | |||
|---|---|---|---|
| Reticulocyte RNA | High | Normal | Low |
| High | Hemolytic anemia | Marrow infiltration | Example not known |
| Normal | Acute marrow response | Normal | Hypoplastic anemia |
| Low | Examples not known | ||