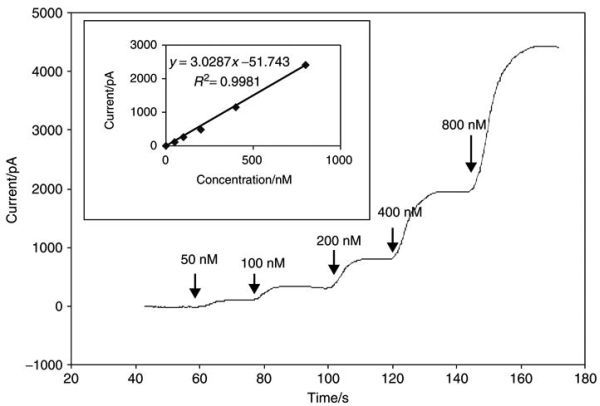
FIGURE 21.3. Response of WPI’s ISO-NOP NO sensor to increasing concentration of chemically generated NO, inset shows the resulting calibration curve.

FIGURE 21.3

Response of WPI’s ISO-NOP NO sensor to increasing concentration of chemically generated NO, inset shows the resulting calibration curve. (Reprinted from Zhang, X. J., Front. Biosci., 9, 3434, 2004. With permission.)

From: Chapter 21, The Principles, Development and Application of Microelectrodes for the In Vivo Determination of Nitric Oxide

Cover of Electrochemical Methods for Neuroscience
Electrochemical Methods for Neuroscience.
Michael AC, Borland LM, editors.
Boca Raton (FL): CRC Press/Taylor & Francis; 2007.
Copyright © 2007, Taylor & Francis Group, LLC.

NCBI Bookshelf. A service of the National Library of Medicine, National Institutes of Health.