

NCBI Bookshelf. A service of the National Library of Medicine, National Institutes of Health.
National Center for Health Statistics (US) . Health, United States, 2005: With Chartbook on Trends in the Health of Americans. Hyattsville (MD): National Center for Health Statistics (US); 2005 Nov.
Health, United States, 2005: With Chartbook on Trends in the Health of Americans.
Show detailsAppendix II is an alphabetical listing of terms used in Health, United States. It includes cross-references to related terms and synonyms. It also describes the methods used for calculating age-adjusted rates, average annual rates of change, relative standard errors, birth rates, death rates, and years of potential life lost. Appendix II includes standard populations used for age adjustment (tables I, II, and III); International Classification of Diseases (ICD) codes for cause of death from the Sixth through Tenth Revisions and the years when the Revisions were in effect (tables IV and V); comparability ratios between ICD–9 and ICD–10 for selected causes (table VI); ICD–9–CM codes for external cause of injury, diagnostic, and procedure categories (tables VII, IX, and X); classification of generic analgesic drugs (table XI); and industry codes from the North American Industry Classification System (NAICS) that has replaced the Standard Industrial Classification (SIC) system (table VIII). Standards for presenting Federal data on race and ethnicity are described under Race, and sample tabulations of National Health Interview Survey (NHIS) data comparing the 1977 and 1997 Standards for Federal data on race and Hispanic origin are presented in tables XII and XIII.
Table III. United States standard population and age groups used to age adjust survey data
Table XI. National Drug Code (NDC) therapeutic class analgesic drug recodes
A · B · C · D · E · F · G · H · I · L · M · N · O · P · R · S · T · U · W · Y
A
Acquired immunodeficiency syndrome (AIDS)
Human immunodeficiency virus (HIV) disease is the pathogen that causes AIDS and encompasses all the condition's stages, from infection to the deterioration of the immune system and the onset of opportunistic diseases. However, AIDS is still the name that most people use to refer to the immune deficiency caused by HIV. An AIDS diagnosis (indicating that the person has reached the late stages of the disease) is given to people with HIV who have counts below 200 CD4+ cells/mm3 (also known as T cells or T4 cells, which are the main target of HIV) or when they become diagnosed with at least one of a set of opportunistic diseases. All 50 States and the District of Columbia report AIDS cases to CDC using a uniform surveillance case definition and case report form. The case reporting definitions were expanded in 1985 (MMWR 1985; 34:373–5); 1987 (MMWR 1987; 36(No. SS-1):1S–15S); 1993 for adults and adolescents (MMWR 1992; 41(no. RR-17): 1–19); and 1994 for pediatric cases (MMWR 1994; 43(no. RR-12):1–19). The revisions incorporated a broader range of AIDS-indicator diseases and conditions and used HIV diagnostic tests to improve the sensitivity and specificity of the definition. The 1993 expansion of the case definition caused a temporary distortion of AIDS incidence trends. In 1995, new treatments (protease inhibitors) for HIV and AIDS were approved. These therapies have prevented or delayed the onset of AIDS and premature death among many HIV-infected persons, which should be considered when interpreting trend data. AIDS surveillance data are published annually by CDC in the HIV/AIDS Surveillance Report at www.cdc.gov/hiv/stats/hasrlink.htm. See related Human immunodeficiency virus (HIV) disease .
Active physician
See Physician .
Activities of daily living (ADL)
Activities of daily living are activities related to personal care and include bathing or showering, dressing, getting in or out of bed or a chair, using the toilet, and eating. In the National Health Interview Survey, respondents were asked whether they or family members 3 years of age and over need the help of another person with personal care because of a physical, mental, or emotional problem. Persons are considered to have an ADL limitation if any condition(s) causing the respondent to need help with the specific activities was chronic.
In the Medicare Current Beneficiary Survey (table 141), if a sample person had any difficulty performing an activity by him or herself and without special equipment or did not perform the activity at all because of health problems, the person was categorized as having a limitation in that activity. The limitation may have been temporary or chronic at the time of the interview. Sample persons who were administered a community interview answered health status and functioning questions themselves, if able to do so. A proxy such as a nurse answered questions about the sample person's health status and functioning for those in a long-term care facility. Beginning in 1997, interview questions for persons in long-term care facilities were changed slightly from those administered to persons in the community to differentiate residents who were independent from those who received supervision or assistance with transferring, locomotion on unit, dressing, eating, toilet use, and bathing. See related Condition ; Instrumental activities of daily living (IADL) ; Limitation of activity .
Addition
An addition to a mental health organization is defined by the Substance Abuse and Mental Health Services Administration's Center for Mental Health Services as a new admission, a readmission, a return from long-term leave, or a transfer from another service of the same organization or another organization. See related Mental health organization ; Mental health service type .
Admission
The American Hospital Association defines admissions as persons, excluding newborns, accepted for inpatient services during the survey reporting period. See related Days of care ; Discharge ; Inpatient .
Age
Age is reported as age at last birthday, that is, age in completed years, often calculated by subtracting date of birth from the reference date, with the reference date being the date of the examination, interview, or other contact with an individual.
Mother's (maternal) age is reported on the birth certificate by all States. Birth statistics are presented for mothers age 10–49 years through 1996 and 10–54 years starting in 1997, based on mother's date of birth or age as reported on the birth certificate. The age of mother is edited for upper and lower limits. When the age of the mother is computed to be under 10 years or 55 years or over (50 years or over in 1964–96), it is considered not stated and imputed according to the age of the mother from the previous birth record of the same race and total birth order (total of fetal deaths and live births). Before 1963 not stated ages were distributed in proportion to the known ages for each racial group. Beginning in 1997 the birth rate for the maternal age group 45–49 years includes data for mothers age 50–54 years in the numerator and is based on the population of women 45–49 years in the denominator.
Age adjustment
Age adjustment is used to compare risks of two or more populations at one point in time or one population at two or more points in time. Age-adjusted rates are computed by the direct method by applying age-specific rates in a population of interest to a standardized age distribution, to eliminate differences in observed rates that result from age differences in population composition. Age-adjusted rates should be viewed as relative indexes rather than actual measures of risk.
Age-adjusted rates are calculated by the direct method as follows:

where r i = rate in age group i in the population of interest
p i = standard population in age group i

n = total number of age groups over the age range of the age-adjusted rate
Age adjustment by the direct method requires use of a standard age distribution. The standard for age adjusting death rates and estimates from surveys in Health, United States is the projected year 2000 U.S. resident population. Starting with Health, United States, 2001, the year 2000 U.S. standard population replaces the 1940 U.S. population for age adjusting mortality statistics. The U.S. standard population also replaces the 1970 civilian noninstitutionalized population and 1980 U.S. resident population, which previously had been used as standard age distributions for age adjusting estimates from NCHS surveys.
Changing the standard population has implications for racial and ethnic differentials in mortality. For example, the mortality ratio for the black to white populations is reduced from 1.6 using the 1940 standard to 1.4 using the 2000 standard, reflecting the greater weight that the 2000 standard gives to the older population where race differentials in mortality are smaller.
Age-adjusted estimates from any data source presented in Health, United States may differ from age-adjusted estimates based on the same data presented in other reports if different age groups are used in the adjustment procedure.
For more information on implementing the 2000 population standard for age adjusting death rates, see Anderson RN, Rosenberg HM. Age Standardization of Death Rates: Implementation of the Year 2000 Standard. National vital statistics reports; vol 47 no 3. Hyattsville, MD: National Center for Health Statistics. 1998. For more information on the derivation of age-adjustment weights for use with NCHS survey data, see Klein RJ, Schoenborn CA. Age Adjustment Using the 2000 Projected U.S. Population. Healthy People Statistical Notes no. 20. Hyattsville, MD: National Center for Health Statistics. 2001. Both reports are available through the NCHS home page at www.cdc.gov/nchs. The U.S. standard population is available through the Census Bureau's home page at www.census.gov/prod/1/pop/p25–1130/.
- Mortality data—Death rates are age adjusted to the year 2000 U.S. standard population (table I). Age-adjusted rates are calculated using age-specific death rates per 100,000 population rounded to one decimal place. Adjustment is based on 11 age groups with two exceptions. First, age-adjusted death rates for black males and black females in 1950 are based on nine age groups, with under 1 year and 1–4 years of age combined as one group and 75–84 years and 85 years of age combined as one group. Second, age-adjusted death rates by educational attainment for the age group 25–64 years are based on four 10-year age groups (25–34 years, 35–44 years, 45–54 years, and 55–64 years).Age-adjusted rates for years of potential life lost before age 75 years also use the year 2000 standard population and are based on eight age groups (under 1 year, 1–14 years, 15–24 years, and 10-year age groups through 65–74 years).Maternal mortality rates for pregnancy, childbirth, and the puerperium are calculated as the number of deaths per 100,000 live births. These rates are age adjusted to the 1970 distribution of live births by mother's age in the United States as shown in table II. See related Rate: Death and related rates; Years of potential life lost .
- National Health and Nutrition Examination Survey (NHANES)—Estimates based on the National Health Examination Survey (NHES) and NHANES are age adjusted to the year 2000 U.S. standard population generally using five age groups: 20–34 years, 35–44 years, 45–54 years, 55–64 years, and 65–74 years or 65 years and over (see table III). Prior to Health, United States, 2000, these estimates were age adjusted to the 1980 U.S. resident population.
- National Health Care Surveys—Estimates based on the National Hospital Discharge Survey, the National Ambulatory Medical Care Survey, the National Hospital Ambulatory Medical Care Survey, the National Nursing Home Survey, and the National Home and Hospice Care Survey are age adjusted to the year 2000 U.S. standard population (table III). Information on the age groups used in the age-adjustment procedure is contained in the footnotes to the relevant tables.
- National Health Interview Survey (NHIS)—Estimates based on the NHIS are age adjusted to the year 2000 U.S. standard population (table III). Prior to the 2000 edition of Health, United States, National Health Interview Survey estimates were age adjusted to the 1970 civilian noninstitutionalized population. Information on the age groups used in the age-adjustment procedure is contained in the footnotes to the relevant tables.
AIDS
Alcohol consumption
Alcohol consumption is measured differently in various data systems.
- Monitoring the Future Study—This school-based survey of secondary school students collects information on alcohol use using self-completed questionnaires. Information on consumption of alcoholic beverages, defined as beer, wine, wine coolers, and liquor, is based on the following question: "On how many occasions (if any) have you had alcohol to drink—more than just a few sips—in the last 30 days?" Students responding affirmatively are then asked "How many times have you had five or more drinks in a row in the last 2 weeks?" For this question, a "drink" means a 12-ounce can or bottle of beer, a 4-ounce glass of wine, a 12-ounce bottle or can of wine cooler, or a mixed drink or shot of liquor.
- National Health Interview Survey (NHIS)—Starting with the 1997 NHIS, information on alcohol consumption is collected in the sample adult questionnaire. Adult respondents are asked two screening questions about their lifetime alcohol consumption: "In any one year, have you had at least 12 drinks of any type of alcoholic beverage? In your entire life, have you had at least 12 drinks of any type of alcoholic beverage?" Persons who report at least 12 drinks in a lifetime are then asked a series of questions about alcohol consumption during the past year: "In the past year, how often did you drink any type of alcoholic beverage? In the past year, on those days that you drank alcoholic beverages, on the average, how many drinks did you have? In the past year, on how many days did you have 5 or more drinks of any alcoholic beverage?"
- National Survey on Drug Use and Health (NSDUH)—Starting in 1999, NSDUH information about the frequency of the consumption of alcoholic beverages during the past 30 days has been obtained for all persons surveyed who are 12 years of age and over. An extensive list of examples of the kinds of beverages covered was given to respondents prior to the question administration. A "drink" is defined as a can or bottle of beer, a glass of wine or a wine cooler, a shot of liquor, or a mixed drink with liquor in it. Those times when the respondent had only a sip or two from a drink are not considered consumption. Alcohol use is based on the following questions: "During the past 30 days, on how many days did you drink one or more drinks of an alcoholic beverage?" "On the days that you drank during the past 30 days, how many drinks did you usually have?" And "During the past 30 days, on how many days did you have 5 or more drinks on the same occasion?"
Any-listed diagnosis
See Diagnosis .
Average annual rate of change (percent change)
In Health, United States average annual rates of change or growth rates are calculated as follows:
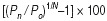
where P n = later time period
P o = earlier time period
N = number of years in interval.
This geometric rate of change assumes that a variable increases or decreases at the same rate during each year between the two time periods.
Average length of stay
In the National Health Interview Survey, average length of stay per discharged inpatient is computed by dividing the total number of hospital days for a specified group by the total number of discharges for that group. Similarly, in the National Hospital Discharge Survey, average length of stay is computed by dividing the total number of days of care, counting the date of admission but not the date of discharge, by the number of patients discharged. The American Hospital Association computes average length of stay by dividing the number of inpatient days by the number of admissions. See related Days of care ; Discharge ; Inpatient .
B
Bed
The American Hospital Association defines the bed count as the number of beds, cribs, and pediatric bassinets that are set up and staffed for use by inpatients on the last day of the reporting period. In the Center for Medicare & Medicaid Service's Online Survey Certification and Reporting (OSCAR) database, all beds in certified facilities are counted on the day of certification inspection. The World Health Organization defines a hospital bed as one regularly maintained and staffed for the accommodation and full-time care of a succession of inpatients and situated in a part of the hospital where continuous medical care for inpatients is provided. The Center for Mental Health Services counts the number of beds set up and staffed for use in inpatient and residential treatment services on the last day of the survey reporting period. See related Hospital ; Mental health organization ; Mental health service type ; Occupancy rate .
Birth cohort
A birth cohort consists of all persons born within a given period of time, such as a calendar year.
Birth rate
Birthweight
Birthweight is the first weight of the newborn obtained after birth. Low birthweight is defined as less than 2,500 grams or 5 pounds 8 ounces. Very low birthweight is defined as less than 1,500 grams or 3 pounds 4 ounces. Before 1979, low birthweight was defined as 2,500 grams or less and very low birthweight as 1,500 grams or less.
Body mass index (BMI)
BMI is a measure that adjusts bodyweight for height. It is calculated as weight in kilograms divided by height in meters squared. Overweight for children and adolescents is defined as BMI at or above the sex- and age-specific 95th percentile BMI cut points from the 2000 CDC Growth Charts (www.cdc.gov/growthcharts/). Healthy weight for adults is defined as a BMI of 18.5 to less than 25; overweight, as greater than or equal to a BMI of 25; and obesity, as greater than or equal to a BMI of 30. BMI cut points are defined in the Report of the Dietary Guidelines Advisory Committee on the Dietary Guidelines for Americans, 2000. U.S. Department of Agriculture, Agricultural Research Service, Dietary Guidelines Advisory Committee, p. 23, or on the Internet at www.health.gov/dietaryguidelines/dgac/; NHLBI Obesity Education Initiative Expert Panel on the Identification, Evaluation, and Treatment of Overweight and Obesity in Adults. Clinical Guidelines on the Identification, Evaluation, and Treatment of Overweight and Obesity in Adults—The Evidence Report. Obes Res 1998. 6:51S-209S or on the Internet at www.nhlbi.nih.gov/guidelines/obesity/ob_gdlns.htm; and in U.S. Department of Health and Human Services. Tracking Healthy People 2010. Washington, DC: U.S. Government Printing Office, November 2000. Objectives 19.1, 19.2, and 19.3, or on the Internet at www.health.gov/healthypeople/document/html/volume2/19nutrition.htm.
C
Cause of death
For the purpose of national mortality statistics, every death is attributed to one underlying condition, based on information reported on the death certificate and using the international rules for selecting the underlying cause of death from the conditions stated on the death certificate. The underlying cause is defined by the World Health Organization (WHO) as the disease or injury that initiated the train of events leading directly to death, or the circumstances of the accident or violence that produced the fatal injury. Generally more medical information is reported on death certificates than is directly reflected in the underlying cause of death. The conditions that are not selected as underlying cause of death constitute the nonunderlying causes of death, also known as multiple cause of death.
Cause of death is coded according to the appropriate revision of the International Classification of Diseases (ICD) (see table IV). Effective with deaths occurring in 1999, the United States began using the Tenth Revision of the ICD (ICD–10); during the period 1979–98, causes of death were coded and classified according to the Ninth Revision (ICD–9). Table V lists ICD codes for the Sixth through Tenth Revisions for causes of death shown in Health, United States.
Each of these revisions has produced discontinuities in cause-of-death trends. These discontinuities are measured using comparability ratios. These measures of discontinuity are essential to the interpretation of mortality trends. For further discussion, see the Mortality Technical Appendix available on the NCHS Web site at www.cdc.gov/nchs/about/major/dvs/mortdata.htm. See related Comparability ratio ; International Classification of Diseases (ICD) ; Appendix I , National Vital Statistics System, Multiple Cause-of-Death File.
Cause-of-death ranking
Selected causes of death of public health and medical importance comprise tabulation lists and are ranked according to the number of deaths assigned to these causes. The top-ranking causes determine the leading causes of death. Certain causes on the tabulation lists are not ranked if, for example, the category title represents a group title (such as Major cardiovascular diseases and Symptoms, signs, and abnormal clinical and laboratory findings, not elsewhere classified); or the category title begins with the words "Other" and "All other." In addition when one of the titles that represents a subtotal (such as Malignant neoplasms) is ranked, its component parts are not ranked. The tabulation lists used for ranking in the Tenth Revision of the International Classification of Diseases (ICD) include the List of 113 Selected Causes of Death, which replaces the ICD–9 List of 72 Selected Causes, HIV infection and Alzheimer's disease; and the ICD–10 List of 130 Selected Causes of Infant Death, which replaces the ICD–9 List of 60 Selected Causes of Infant Death and HIV infection. Causes that are tied receive the same rank; the next cause is assigned the rank it would have received had the lower-ranked causes not been tied, that is, skip a rank. See related International Classification of Diseases (ICD) .
Chronic condition
See Condition .
Cigarette smoking
Cigarette smoking and related tobacco use are measured in several different data systems.
- Birth File—Information on cigarette smoking by the mother during pregnancy is based on Yes/No responses to the birth certificate item "Other risk factors for this pregnancy: Tobacco use during pregnancy" and the average number of cigarettes per day with no specificity on timing during pregnancy. This information became available for the first time in 1989 with revision of the U.S. Standard Certificate of Live Birth. In 1989, 43 States and the District of Columbia collected data on tobacco use. The following States did not require the reporting of tobacco use in the standard format on the birth certificate: California, Indiana, Louisiana, Nebraska, New York, Oklahoma, and South Dakota. In 1990, information on tobacco use became available from Louisiana and Nebraska, increasing the number of reporting States to 45 and the District of Columbia. In 1991–93, with the addition of Oklahoma to the reporting area, information on tobacco use was available for 46 States and the District of Columbia; in 1994–98, 46 States, the District of Columbia, and New York City reported tobacco use; in 1999 information on tobacco use became available from Indiana and New York, increasing the number of reporting States to 48 and the District of Columbia; starting in 2000, with the addition of South Dakota, the reporting area includes 49 States and the District of Columbia. During 1989–2002, California did not require the reporting of tobacco use. The areas reporting tobacco use comprised 87 percent of U.S. births in 1999–2002. In 2003, data on smoking during pregnancy was included for all States except California, Pennsylvania, and Washington, and comprised 81 percent of births. California did not report this information. Pennsylvania and Washington implemented the 2003 revision of the U.S. Standard Certificate of Live Birth, which asked for the number of cigarettes smoked at different intervals before and during pregnancy. Data from the 2003 revision of the birth certificate are not comparable with data from the 1989 revision used by other reporting areas.
- Monitoring the Future Survey—Information on current cigarette smoking is obtained for high school seniors (starting in 1975) and 8th and 10th graders (starting in 1991) based on the following question: "How frequently have you smoked cigarettes during the past 30 days?"
- National Health Interview Survey (NHIS)—Information about cigarette smoking is obtained for adults 18 years of age and over. Starting in 1993, current smokers are identified by asking the following two questions: "Have you smoked at least 100 cigarettes in your entire life?" and "Do you now smoke cigarettes every day, some days, or not at all?" Persons who smoked 100 cigarettes and who now smoke every day or some days are defined as current smokers. Before 1992, current smokers were identified based on positive responses to the following two questions: "Have you smoked 100 cigarettes in your entire life?" and "Do you smoke now?" (traditional definition). In 1992, the definition of current smoker in the NHIS was modified to specifically include persons who smoked on "some days" (revised definition). In 1992 cigarette smoking data were collected for a half sample with half the respondents (one-quarter sample) using the traditional smoking questions and the other half of the respondents (one-quarter sample) using the revised smoking question ("Do you smoke every day, some days, or not at all?"). An unpublished analysis of the 1992 traditional smoking measure revealed that the crude percentage of current smokers 18 years of age and over remained the same as for 1991. The statistics for 1992 combine data collected using the traditional and the revised questions.In 1993–95 estimates of cigarette smoking prevalence were based on a half sample. Smoking data were not collected in 1996. Starting in 1997 smoking data were collected in the sample adult questionnaire. For further information on survey methodology and sample sizes pertaining to the NHIS cigarette smoking data for data years 1965–92 and other sources of cigarette smoking data available from the National Center for Health Statistics, see National Center for Health Statistics. Bibliographies and Data Sources, Smoking Data Guide, no 1, DHHS pub no (PHS) 91–1308-1, Public Health Service. Washington: U.S. Government Printing Office. 1991.
- National Survey on Drug Use & Health (NSDUH)—Information on current cigarette smoking is obtained for all persons surveyed who are 12 years of age and over based on the following question: "During the past 30 days, have you smoked part or all of a cigarette?"
- Youth Risk Behavior Survey—Information on current cigarette smoking is obtained from high school students (starting in 1991) based on the following question: "During the past 30 days, on how many days did you smoke cigarettes?"
Civilian noninstitutionalized population; Civilian population
See Population .
Cohort fertility
Cohort fertility refers to the fertility of the same women at successive ages. Women born during a 12-month period constitute a birth cohort. Cohort fertility for birth cohorts of women is measured by central birth rates, which represent the number of births occurring to women of an exact age divided by the number of women of that exact age. Cumulative birth rates by a given exact age represent the total childbearing experience of women in a cohort up to that age. Cumulative birth rates are sums of central birth rates for specified cohorts and show the number of children ever born up to the indicated age. For example, the cumulative birth rate for women exactly 30 years of age as of January 1, 1960, is the sum of the central birth rates for the 1930 birth cohort for the years 1944 (when its members were age 14) through 1959 (when they were age 29). Cumulative birth rates are also calculated for specific birth orders at each exact age of woman. The percentage of women who have not had at least one live birth by a certain age is found by subtracting the cumulative first birth rate for women of that age from 1,000 and dividing by 10. For method of calculation, see Heuser RL. Fertility tables for birth cohorts by color: United States, 1917–73. Rockville, MD: NCHS. 1976. See related Rate: Birth and related rates.
Community hospitals
See Hospital .
Comparability ratio
About every 10–20 years, the International Classification of Diseases (ICD) is revised to stay abreast of advances in medical science and changes in medical terminology. Each of these revisions produces breaks in the continuity of cause-of-death statistics. Discontinuities across revisions are due to changes in classification and rules for selecting underlying cause of death. Classification and rule changes affect cause-of-death trend data by shifting deaths away from some cause-of-death categories and into others. Comparability ratios measure the effect of changes in classification and coding rules. For causes shown in table VI, comparability ratios range between 0.6974 and 1.1404. Influenza and pneumonia had the lowest comparability ratio (0.6974), indicating that influenza and pneumonia is about 30 percent less likely to be selected as the underlying cause of death in ICD–10 than in ICD–9. Pregnancy, childbirth, and the puerperium had the highest comparability ratio (1.1404), indicating that pregnancy is more than 14 percent more likely to be selected as the underlying cause using ICD–10 coding.
For selected causes of death, the ICD–9 codes used to calculate death rates for 1980–1998 differ from the ICD–9 codes most nearly comparable with the corresponding ICD–10 cause-of-death category, which also affects the ability to compare death rates across ICD revisions. Examples of these causes are ischemic heart disease; cerebrovascular diseases; trachea, bronchus, and lung cancer; unintentional injuries; and homicide. To address this source of discontinuity, mortality trends for 1980–98 were recalculated, using ICD–9 codes that are more comparable with codes for corresponding ICD–10 categories. Table V shows the ICD–9 codes used for these causes. Although this modification may lessen the discontinuity between the Ninth and Tenth Revisions, the effect on the discontinuity between the Eighth and Ninth Revisions is not measured.
Comparability ratios shown in table VI are based on a comparability study in which the same deaths were coded by both the Ninth and Tenth Revisions. The comparability ratio was calculated by dividing the number of deaths classified by ICD–10 by the number of deaths classified by ICD–9. The resulting ratios represent the net effect of the Tenth Revision on cause-of-death statistics and can be used to adjust mortality statistics for causes of death classified by the Ninth Revision to be comparable with cause-specific mortality statistics classified by the Tenth Revision.
The application of comparability ratios to mortality statistics helps make the analysis of change between 1998 and 1999 more accurate and complete. The 1998 comparability-modified death rate is calculated by multiplying the comparability ratio by the 1998 death rate. Comparability-modified rates should be used to estimate mortality change between 1998 and 1999.
Caution should be taken when applying the comparability ratios presented in table VI to age-, race-, and sex-specific mortality data. Demographic subgroups may sometimes differ with regard to their cause-of-death distribution, and this would result in demographic variation in cause-specific comparability ratios.
For more information, see Anderson RN, Minino AM, Hoyert DL, Rosenberg HM. Comparability of cause of death between ICD–9 and ICD–10: Preliminary estimates; Kochanek KD, Smith BL, Anderson RN. Deaths: Preliminary data for 1999. National vital statistics reports. Vol. 49 no. 2 and vol. 49 no. 3. Hyattsville, MD: National Center for Health Statistics. 2001; and Final and preliminary comparability ratios for 113 selected causes of death at ftp://ftp.cdc.gov/pub/Health_Statistics/NCHS/Datasets/Comparability/icd9_icd10/. See related Cause of death ; International Classification of Diseases (ICD) ; tables IV , V , and VI .
Compensation
Condition
A health condition is a departure from a state of physical or mental well-being. In the National Health Interview Survey, each condition reported as a cause of an individual's activity limitation has been classified as "chronic," "not chronic," or "unknown if chronic," based on the nature and duration of the condition. Conditions that are not cured once acquired (such as heart disease, diabetes, and birth defects in the original response categories, and amputee and old age in the ad hoc categories) are considered chronic, whereas conditions related to pregnancy are always considered not chronic. In addition, other conditions must have been present 3 months or longer to be considered chronic. An exception is made for children less than 1 year of age who have had a condition "since birth," as these conditions are always considered chronic. The National Nursing Home Survey uses a specific list of chronic conditions, disregarding time of onset.
Consumer Price Index (CPI)
The CPI is prepared by the U.S. Bureau of Labor Statistics. It is a monthly measure of the average change in the prices paid by urban consumers for a fixed market basket of goods and services. The medical care component of CPI shows trends in medical care prices based on specific indicators of hospital, medical, dental, and drug prices. A revision of the definition of CPI has been in use since January 1988. See related Gross domestic product (GDP) ; Health expenditures, national ; Appendix I , Consumer Price Index.
Contraception
The National Survey of Family Growth collects information on contraceptive use as reported by women 15–44 years of age, during heterosexual vaginal intercourse. For current contraceptive use, women were asked about contraceptive use during the month of interview. Women were classified by whether they reported using each of 19 methods of contraception at any time in the month of interview. Data show up to four methods used in the month of interview. Contraceptive methods listed as other methods include the following: for 2002, the female condom, foam, cervical cap, Today Sponge®, suppository or insert, jelly or cream, or other method; for 1995, the female condom or vaginal pouch, foam, cervical cap, Today Sponge®, suppository or insert, jelly or cream, or other method; for 1988, foam, douche, Today Sponge®, suppository or insert, jelly or cream, or other method; and for 1982, foam, douche, suppository or insert, or other method.
Crude birth rate; Crude death rate
See Rate: Birth and related rates; Rate: Death and related rates .
D
Days of care
Days of care is defined similarly in different data systems. See related Admission ; Average length of stay ; Discharge ; Hospital ; Hospital utilization ; Inpatient .
- American Hospital Association—Days, hospital days, or inpatient days are the number of adult and pediatric days of care rendered during the entire reporting period. Days of care for newborns are excluded.
- National Health Interview Survey (NHIS)—Hospital days during the year refer to the total number of hospital days occurring in the 12-month period before the interview week. A hospital day is a night spent in the hospital for persons admitted as inpatients. Starting in 1997 hospitalization data from NHIS are for all inpatient stays, whereas estimates for prior years published in Health, United States excluded hospitalizations for deliveries and newborns.
- National Hospital Discharge Survey—Days of care refers to the total number of patient days accumulated by inpatients at the time of discharge from non-Federal short-stay hospitals during a reporting period. All days from and including the date of admission but not including the date of discharge are counted.
Death rate
Dental caries
Dental caries is evidence of dental decay on any surface of a tooth. Dental caries was determined by an oral examination conducted by a trained dentist as part of the National Health and Nutrition Examination Survey. Study participants 2 years of age and over were eligible for the examination, as long as they did not meet other exclusion criteria. Both permanent and primary (or baby) teeth were evaluated.
Dental visit
Starting in 1997, National Health Interview Survey respondents were asked "About how long has it been since you last saw or talked to a dentist? Include all types of dentists, such as orthodontists, oral surgeons, and all other dental specialists as well as hygienists." Starting in 2001, the question was modified slightly to ask respondents how long it had been since they last saw a dentist. Questions about dental visits were not asked for children under 2 years of age for years 1997–99 and under 1 year of age for 2000 and beyond. Starting with data year 1997 estimates are presented for persons with a dental visit in the past year. Prior to 1997, dental visit estimates were based on a 2-week recall period.
Diagnosis
Diagnosis is the act or process of identifying or determining the nature and cause of a disease or injury through evaluation of patient history, examination, and review of laboratory data. Diagnoses in the National Hospital Discharge Survey, the National Ambulatory Medical Care Survey, the National Hospital Ambulatory Medical Care Survey, the National Nursing Home Survey, and the National Home and Hospice Care Survey are abstracted from medical records and coded to the International Classification of Diseases, Ninth Revision, Clinical Modification (ICD–9–CM). For a given medical care encounter, the first-listed diagnosis can be used to categorize the visit, or if more than one diagnosis is recorded on the survey abstraction form, the visit can be categorized based on all diagnoses recorded. Analyzing first-listed diagnoses avoids double-counting events such as visits or hospitalizations; the first-listed diagnosis is often, but not always, considered the most important or dominant condition among all comorbid conditions. For example, a hospital discharge would be considered a first-listed stroke discharge if the ICD–9–CM diagnosis code for stroke was recorded in the first diagnosis field on the survey form. An any listed stroke discharge would classify all diagnoses of stroke recorded on the survey abstraction form regardless of order. Any-listed diagnoses double count events such as visits or hospitalizations with more than one recorded diagnosis but provide information on the burden a specific diagnosis presents to the health care system. See related External cause of injury ; Injury ; Injury-related visit .
Diagnostic and other nonsurgical procedures
See Procedure .
Discharge
The National Health Interview Survey defines a hospital discharge as the completion of any continuous period of stay of 1 night or more in a hospital as an inpatient. According to the National Hospital Discharge Survey, a discharge is a completed inpatient hospitalization. A hospitalization may be completed by death or by releasing the patient to the customary place of residence, a nursing home, another hospital, or other locations. See related Admission ; Average length of stay ; Days of care ; Inpatient .
Domiciliary care homes
See Long-term care facility ; Nursing home .
Drug abuse
See Illicit drug use .
Drug class, major
Major drug class is a general therapeutic or pharmacological classification scheme for drug products reported to the Food and Drug Administration under the provisions of the Drug Listing Act. The classification scheme used was based on the AMA DRUG EVALUATIONS SUBSCRIPTION and generally follows the organization of material in that publication. The drug class for each product was determined by the labeled indication(s). See related National Drug Code (NDC) Directory therapeutic class .
Drugs
Drugs are pharmaceutical agents—by any route of administration—for prevention, diagnosis, or treatment of medical conditions or diseases. Data on specific drug use are collected in three NCHS surveys.
- National Ambulatory Medical Care Survey (NAMCS) and National Hospital Ambulatory Medical Care Survey (NHAMCS)—Data collection in the NAMCS and NHAMCS outpatient department component is from the medical record of an inperson physician office or hospital outpatient department visit, rather than from the patient. Generic or brand name drugs are abstracted from the medical record, including prescription and over-the-counter drugs, immunizations, allergy shots, and anesthetics that were prescribed, ordered, supplied, administered, or continued during the visit. Prior to 1995, up to five drugs per visit could be reported on the Patient Record Form; in data years 1995 and beyond, up to six drugs could be reported. Beginning with data year 2003, eight drugs could be reported, as well as a count of the total number of drugs prescribed, ordered, supplied, administered, or continued during the visit. For more information on drugs collected by the NAMCS and NHAMCS, see the NAMCS drug database at www.cdc.gov/nchs/about/major/ahcd/ambulatory.htm, or ftp://ftp.cdc.gov/pub/Health_Statistics/NCHS/Dataset_Documentation/NAMCS/doc01.pdf. For more information on how drugs are classified into therapeutic use categories, see National Drug Code (NDC) Directory therapeutic class. See related Appendix I , National Ambulatory Medical Care Survey and National Hospital Ambulatory Medical Care Survey.
- National Health and Nutrition Examination Survey (NHANES)—Drug information from NHANES III and 1999–2002 NHANES was collected during an inperson interview conducted in the participant's home. Participants were asked whether they had taken a medication in the past month for which they needed a prescription. Those who answered "Yes" were asked to produce the prescription medication containers for the interviewer. For each medication reported, the interviewer entered the product's complete name from the container. If no container was available, the interviewer asked the participant to verbally report the name of the medication. In addition, participants were asked how long they had been taking the medication and the main reason for use.All reported medication names were converted to their standard generic ingredient name. For multi-ingredient products, the ingredients were listed in alphabetical order and counted as one drug (e.g., Tylenol #3 was listed as Acetaminophen; Codeine). No trade or proprietary names are provided on the data file.Drug data from NHANES provide a snapshot of all prescribed drugs reported by a sample of the civilian noninstitutionalized population for a 1-month period. Drugs taken on an irregular basis, such as every other day, once per week, or for a 10-day period, etc., were captured in the 1-month recall period. Data shown in Health, United States for the percent of the population reporting three or more prescription drugs during the past month include a range of drug utilization patterns—for example, persons who took three or more drugs on a daily basis during the past month or persons who took a different drug three separate times—as long as at least three different drugs were taken during the past month.For more information on prescription drug data collection and coding in the NHANES 1999–2000, see www.cdc.gov/nchs/data/nhanes/frequency/rxq_rxdoc.pdf. For more information on NHANES III prescription drug data collection and coding, see www.cdc.gov/nchs/data/nhanes/nhanes3/PUPREMED-acc.pdf. See related Appendix I , National Health and Nutrition Examination Survey.
E
Education
Several approaches to defining educational categories are used in this report. In survey data, educational categories are based on information about educational credentials, such as diplomas and degrees. In vital statistics, educational attainment is based on years of school completed.
- Birth File—Information on educational attainment of mother is based on number of years of school completed, as reported by the mother on the birth certificate. Between 1970 and 1992, the reporting area for maternal education expanded.Mother's education was reported on the birth certificate by 38 States in 1970. Data were not available from Alabama, Arkansas, California, Connecticut, Delaware, District of Columbia, Georgia, Idaho, Maryland, New Mexico, Pennsylvania, Texas, and Washington. In 1975, these data became available from Connecticut, Delaware, Georgia, Maryland, and the District of Columbia, increasing the number of States reporting mother's education to 42 and the District of Columbia. Between 1980 and 1988, only three States, California, Texas, and Washington, did not report mother's education. In 1988, mother's education was also missing from New York State outside New York City. In 1989–91, mother's education was missing only from Washington and New York State outside New York City. During 1992–2002, mother's education was reported by all 50 States and the District of Columbia. In 2003, data on mother's education is included for all States except Pennsylvania and Washington, both of which implemented the 2003 revision of the U.S. Standard Certificate of Live Birth. The education item on the 2003 revision asks for the highest degree or level of school completed whereas the education item on the 1989 revision asks for highest grade completed. Data from the 1989 and 2003 certificate items on educational attainment are too dissimilar to be reliably combined.
- Mortality File—Information on educational attainment of decedent became available for the first time in 1989 because of a revision of the U.S. Standard Certificate of Death. Decedent's educational attainment is reported on the death certificate by the funeral director based on information provided by an informant such as next of kin. Mortality data by educational attainment for 1989 were based on data from 20 States and by 1994–96, increased to 45 States and the District of Columbia (DC). In 1994–96, either the following States did not report educational attainment on the death certificate or the information was more than 20 percent incomplete: Georgia, Kentucky, Oklahoma, Rhode Island, and South Dakota. In 1997–2000, information on decedent's education was available from Oklahoma, increasing the reporting area to 46 States and the DC. With the addition of Kentucky, the reporting area increased to 47 States and DC in 2001 and 2002.Calculation of unbiased death rates by educational attainment based on the National Vital Statistics System requires that the reporting of education on the death certificate be complete and consistent with the reporting of education on the Current Population Survey (CPS), the source of population estimates for denominators for death rates. Death records that are missing information about decedent's education are not included in the calculation of rates. Therefore the levels of death rates by educational attainment shown in this report are underestimated by approximately the percentage with not stated education, which ranges from 3 to 9 percent.The validity of information about the decedent's education was evaluated by comparing self-reported education obtained in the CPS with education on the death certificate for decedents in the National Longitudinal Mortality Survey (NLMS). (Sorlie PD, Johnson NJ. Validity of education information on the death certificate. Epidemiology 7(4):437–9), 1996. Another analysis compared self-reported education collected in the first National Health and Nutrition Examination Survey (NHANES I) with education on the death certificate for decedents in the NHANES I Epidemiologic Followup Study. (Makuc DM, Feldman JJ, Mussolino ME. Validity of education and age as reported on death certificates. American Statistical Association. 1996 Proceedings of the Social Statistics Section 102–6). Results of both studies indicated that there is a tendency for some people who did not graduate from high school to be reported as high school graduates on the death certificate. This tendency results in overstating the death rate for high school graduates and understating the death rate for the group with less than 12 years of education. The bias was greater among older than younger decedents and somewhat greater among black than white decedents.In addition, educational gradients in death rates based on the National Vital Statistics System were compared with those based on the NLMS, a prospective study of persons in the CPS. Results of these comparisons indicate that educational gradients in death rates based on the National Vital Statistics System were reasonably similar to those based on NLMS for white persons 25–64 years of age and black persons 25–44 years of age. The number of deaths for persons of Hispanic origin in NLMS was too small to permit comparison for this ethnic group. For further information on measurement of education, see Kominski R and Siegel PM. Measuring education in the Current Population Survey. Monthly Labor Review, 34–8. September 1993.
- National Health Interview Survey (NHIS)—Beginning in 1997, the NHIS questionnaire was changed to ask "What is the highest level of school ___ has completed or the highest degree received?" Responses were used to categorize adults according to educational credentials (e.g., no high school diploma or general educational development (GED) high school equivalency diploma; high school diploma or GED; some college, no bachelor's degree; bachelor's degree or higher).Prior to 1997, the education variable in NHIS was measured by asking, "What is the highest grade or year of regular school ___ has ever attended?" and "Did ___ finish the grade/year?" Responses were used to categorize adults according to years of education completed (e.g., less than 12 years, 12 years, 13–15 years, and 16 or more years).Data from the 1996 and 1997 NHIS were used to compare distributions of educational attainment for adults 25 years of age and over using categories based on educational credentials (1997) with categories based on years of education completed (1996). A larger percentage of persons reported "some college" than "13–15 years" of education and a correspondingly smaller percentage reported "high school diploma or GED" than "12 years of education." In 1997, 19 percent of adults reported no high school diploma, 31 percent a high school diploma or GED, 26 percent some college, and 24 percent a bachelor's degree or higher. In 1996, 18 percent of adults reported less than 12 years of education, 37 percent 12 years of education, 20 percent 13–15 years, and 25 percent 16 or more years of education.
Emergency department
According to the National Hospital Ambulatory Medical Care Survey, an emergency department is a hospital facility that provides unscheduled outpatient services to patients whose conditions require immediate care and is staffed 24 hours a day. Off-site emergency departments open less than 24 hours are included if staffed by the hospital's emergency department. See related Emergency department or emergency room visit ; Outpatient department .
Emergency department or emergency room visit
Starting with the 1997 National Health Interview Survey, respondents to the sample adult and sample child questionnaires (generally the parent) were asked about the number of visits to hospital emergency rooms during the past 12 months, including visits that resulted in hospitalization. In the National Hospital Ambulatory Medical Care Survey, an emergency department visit is a direct personal exchange between a patient and a physician or other health care providers working under the physician's supervision for the purpose of seeking care and receiving personal health services. See related Emergency department ; Injury-related visit .
Employer costs for employee compensation
This is a measure of the average cost per employee hour worked to employers for wages and salaries and benefits. Wages and salaries are defined as the hourly straight-time wage rate or, for workers not paid on an hourly basis, straight-time earnings divided by the corresponding hours. Straight-time wage and salary rates are total earnings before payroll deductions, excluding premium pay for overtime and for work on weekends and holidays, shift differentials, nonproduction bonuses, and lump-sum payments provided in lieu of wage increases. Production bonuses, incentive earnings, commission payments, and cost-of-living adjustments are included in straight-time wage and salary rates. Benefits covered are paid leave—paid vacations, holidays, sick leave, and other leave; supplemental pay—premium pay for overtime and work on weekends and holidays, shift differentials, nonproduction bonuses, and lump-sum payments provided in lieu of wage increases; insurance benefits—life, health, and sickness and accident insurance; retirement and savings benefits—pension and other retirement plans and savings and thrift plans; legally required benefits—Social Security, railroad retirement and supplemental retirement, railroad unemployment insurance, Federal and State unemployment insurance, workers' compensation, and other benefits required by law, such as State temporary disability insurance; and other benefits—severance pay and supplemental unemployment plans. See related Appendix I , National Compensation Survey.
Ethnicity
See Hispanic origin .
Exercise
Expenditures
See Health expenditures, national ; Appendix I , National Health Accounts.
External cause of injury
The ICD–9 External Cause Matrix is a two-dimensional array describing both the mechanism or external cause of the injury (e.g., fall, motor vehicle traffic) and the manner or intent of the injury (e.g., self-inflicted or assault). Although this matrix was originally developed for mortality, it has been adapted for use with the ICD–9–CM. For more information, see http://www.cdc.gov/nchs/about/otheract/injury/tools.htm .
F
Family income
For purposes of the National Health Interview Survey and National Health and Nutrition Examination Survey, all people within a household related to each other by blood, marriage, or adoption constitute a family. Each member of a family is classified according to the total income of the family. Unrelated individuals are classified according to their own income.
- National Health Interview Survey (NHIS)—In the NHIS (prior to 1997), family income was the total income received by members of a family (or by an unrelated individual) during the 12 months before the interview. Starting in 1997, the NHIS collected family income data for the calendar year prior to the interview (e.g., 2003 family income data were based on calendar year 2002 information). Family income includes wages, salaries, rents from property, interest, dividends, profits and fees from their own businesses, pensions, and help from relatives. Family income data are used in the computation of poverty level. Starting with Health, United States, 2004, a new methodology for imputing family income data for NHIS data was implemented for data years 1997 and beyond. Multiple imputations were performed for survey years 1997 and beyond with five sets of imputed values created to allow for the assessment of variability caused by imputation. Family income was missing for 24–29 percent of persons in 1997–98 and 31–33 percent in 1999–2003. A detailed description of the multiple imputation procedure, as well as data files for 1997 and beyond, are available from NCHS on the NHIS Web site (www.cdc.gov/nchs/nhis.htm), via the Imputed Income Files link under that year. For data years 1990–96, about 16–18 percent of persons had missing data on poverty level. In those years, missing values were imputed for family income using a sequential hot deck within matrix cells imputation approach. A detailed description of the imputation procedure, as well as data files with imputed annual family income for 1990–96, is available from NCHS on CD-ROM, NHIS Imputed Annual Family Income 1990–96, series 10, no 9A.
- National Health and Nutrition Examination Survey (NHANES)—In the NHANES 1999 and onward, family income is asked in a series of questions about possible sources of income, including wages, salaries, interest and dividends, Federal programs, child support, rents, royalties, and other possible sources of income. After the information about sources of income was obtained in the Family Interview Income section of the questionnaire, the respondent was asked to report total combined family income for themselves and the other members of their family, in dollars. If the respondent did not provide an answer or did not know the total combined family income, they were asked if the total family income was less than $20,000 or more than $20,000. If the respondent answered, a followup question asked the respondent to select an income range from a list on a printed hand card. The midpoint of the income range was then used as the total family income value. Family income values were used to calculate the Poverty Income ratio. NHANES III did not ask the detailed components of income questions but asked respondents to identify their income based on a set of ranges provided on a flashcard, whereas NHANES II did include questions on components of income. Family income was not imputed for individuals or families with no reported income information in any of the NHANES survey years. See related Poverty level .
Federal hospitals
See Hospital .
Fee-for-service health insurance
This is private (commercial) health insurance that reimburses health care providers on the basis of a fee for each health service provided to the insured person. It is also known as indemnity health insurance. Medicare Parts A and B are sometimes referred to as "Medicare fee-for-service." See related Health insurance coverage ; Medicare .
Fertility rate
G
General hospitals
See Hospital .
General hospitals providing separate psychiatric services
Geographic region and division
The U.S. Census Bureau groups the 50 States and the District of Columbia for statistical purposes into four geographic regions—Northeast, Midwest, South, and West—and nine divisions, based on geographic proximity. See figure I.
Figure I
Census Bureau: Four Geographic Regions and 9 Divisions of the United States
The Department of Commerce's Bureau of Economic Analysis (BEA) groups States into eight regions based on their homogeneity with respect to income characteristics, industrial composition of the employed labor force, and such noneconomic factors as demographic, social, and cultural characteristics. See figure II.
Figure II
Bureau of Economic Analysis: Eight Geographic Regions of the United States
Three Census Bureau divisions—West North Central, East North Central, and New England—and three BEA regions—Plains, Great Lakes, and New England—are composed of the same States. The States composing the remaining Census Bureau divisions differ from those composing the corresponding BEA regions.
Gestation
For the National Vital Statistics System and the Centers for Disease Control and Prevention's Abortion Surveillance, the period of gestation is defined as beginning with the first day of the last normal menstrual period and ending with the day of birth or day of termination of pregnancy.
Gross domestic product (GDP)
GDP is the market value of the goods and services produced by labor and property located in the United States. As long as the labor and property are located in the United States, the suppliers (i.e., the workers and, for property, the owners) may be U.S. residents or residents of other countries. See related Consumer Price Index (CPI) ; Health expenditures, national .
H
Health care contact
Starting in 1997, the National Health Interview Survey has been collecting information on health care contacts with doctors and other health care professionals using the following questions: "During the past 12 months, how many times have you gone to a hospital emergency room about your own health?" "During the past 12 months, did you receive care at home from a nurse or other health care professional? What was the total number of home visits received?" "During the past 12 months, how many times have you seen a doctor or other health care professional about your own health at a doctor's office, a clinic, or some other place? Do not include times you were hospitalized overnight, visits to hospital emergency rooms, home visits, or telephone calls." Beginning in 2000 this question was amended to exclude dental visits also. For each question respondents were shown a flashcard with response categories of 0, 1, 2–3, 4–9, 10–12, or 13 or more visits in 1997–99. Starting in 2000, response categories were expanded to 0, 1, 2–3, 4–5, 6–7, 8–9, 10–12, 13–15, or 16 or more. Analyses of the percentage of persons with health care visits were tabulated as follows: For tabulation of the 1997–99 data, responses of 2–3 were recoded to 2, and responses of 4–9 were recoded to 6. Starting in 2000, tabulation of responses of 2–3 were recoded to 2, and other responses were recoded to the midpoint of the range. A summary measure of health care visits was constructed by adding recoded responses for these questions and categorizing the sum as none, 1–3, 4–9, or 10 or more health care visits during the past 12 months.
Analyses of the percent of children without a health care visit are based on the following question: "During the past 12 months, how many times has ___ seen a doctor or other health care professional about (his/her) health at a doctor's office, a clinic, or some other place? Do not include times ____ was hospitalized overnight, visits to hospital emergency rooms, home visits, or telephone calls." See related Emergency department or emergency room visit ; Home visit .
Health expenditures, national
National Health Expenditures are estimated by the Centers for Medicare & Medicaid Services (CMS) and measure spending for health care in the United States by type of service delivered (e.g., hospital care, physician services, nursing home care) and source of funding for those services (e.g., private health insurance, Medicare, Medicaid, out-of-pocket spending). CMS produces both historical and projected estimates of health expenditures by category. See related Consumer price index (CPI) ; Gross domestic product (GDP) .
- Health services and supplies expenditures—These are outlays for goods and services relating directly to patient care plus expenses for administering health insurance programs and government public health activities. This category is equivalent to total national health expenditures minus expenditures for research and construction.
- National health expenditures—This measure estimates the amount spent for all health services and supplies and health-related research and construction activities consumed in the United States during the calendar year. Detailed estimates are available by source of expenditures (e.g., out-of-pocket payments, private health insurance, and government programs) and by type of expenditures (e.g., hospital care, physician services, and drugs) and are in current dollars for the year of report. Data are compiled from a variety of sources.
- Nursing home expenditures—These cover care rendered in establishments primarily engaged in providing inpatient nursing and rehabilitative services and continuous personal care services to persons requiring nursing care (skilled nursing and intermediate care facilities, including those for the mentally retarded) and continuing care retirement communities with on-site nursing care facilities. The costs of long-term care provided by hospitals are excluded.
- Personal health care expenditures—These are outlays for goods and services relating directly to patient care. The expenditures in this category are total national health expenditures minus expenditures for research and construction, health insurance program administration, and government public health activities.
- Private expenditures—These are outlays for services provided or paid for by nongovernmental sources—consumers, insurance companies, private industry, and philanthropic and other nonpatient care sources.
- Public expenditures—These are outlays for services provided or paid for by Federal, State, and local government agencies or expenditures required by governmental mandate (such as worker's compensation insurance payments).
Health insurance coverage
Health insurance is broadly defined to include both public and private payors who cover medical expenditures incurred by a defined population in a variety of settings.
- National Health Interview Survey (NHIS)—NHIS respondents were asked about their health insurance coverage in the previous month in 1993–96 and at the time of the interview in other years. Questions on health insurance coverage were expanded starting in 1993 compared with previous years. In 1997, the entire questionnaire was redesigned and data were collected using a computer-assisted personal interview (CAPI).Respondents are covered by private health insurance if they indicate private health insurance or if they are covered by a single-service hospital plan, except in 1997 and 1998, when no information on single-service plans was obtained. Private health insurance includes managed care such as health maintenance organizations (HMOs).Until 1996, persons were defined as having Medicaid or other public assistance coverage if they indicated that they had either Medicaid or other public assistance or if they reported receiving Aid to Families with Dependent Children (AFDC) or Supplemental Security Income (SSI). After welfare reform in late 1996, Medicaid was delinked from AFDC and SSI. Starting in 1997, persons are considered to be covered by Medicaid if they report Medicaid or a State-sponsored health program. Starting in 1998, persons are considered to be covered by Medicaid if they report being covered by the State Children's Health Insurance Program (SCHIP). Medicare or military health plan coverage is also determined in the interview, and starting in 1997 other government-sponsored program coverage is determined as well.If respondents do not report coverage under one of the above types of plans and they have unknown coverage under either private health insurance or Medicaid, they are considered to have unknown coverage.The remaining respondents are considered uninsured. The uninsured are persons who do not have coverage under private health insurance, Medicare, Medicaid, public assistance, a State-sponsored health plan, other government-sponsored programs, or a military health plan. Persons with only Indian Health Service coverage are considered uninsured. Estimates of the percentage of persons who are uninsured based on the NHIS may differ slightly from those based on the March Current Population Survey (CPS) because of differences in survey questions, recall period, and other aspects of survey methodology.In the NHIS, less than 2 percent of persons age 65 years and over reported no current health insurance coverage, but the small sample size precludes the presentation of separate estimates for this population. Therefore, the term "uninsured" refers only to the population under age 65.In the NHIS, the category "Medicare HMO" is defined as persons age 65 years or over who responded "Yes" when asked whether they were under a Medicare managed care arrangement such as an HMO. This is a subset of Medicare Part C. Respondents who stated they had Medicare coverage but did not answer "Yes" to the "managed care arrangement such as an HMO" are included in the Medicare fee-for-service category. Medicare fee-for-service is defined as Medicare Part A or Part B. The majority of these people had coverage from another source, primarily employer-sponsored retiree health insurance. Some tables in Health, United States further classify persons 65 years of age and over with "Medicare fee-for service" into "Medicare fee-for-service only" and Private (including Medicare fee-for-service) coverage.
See related Fee-for-service health insurance ; Health maintenance organization (HMO) ; Managed care ; Medicaid ; Medicare ; State Children's Health Insurance Program (SCHIP) ; Uninsured .
Health maintenance organization (HMO)
An HMO is a health care system that assumes or shares both the financial risks and the delivery risks associated with providing comprehensive medical services to a voluntarily enrolled population in a particular geographic area, usually in return for a fixed, prepaid fee. Pure HMO enrollees use only the prepaid capitated health services of the HMO panel of medical care providers. Open-ended HMO enrollees use the prepaid HMO health services but, in addition, may receive medical care from providers who are not part of the HMO panel. There is usually a substantial deductible, copayment, or coinsurance associated with use of nonpanel providers.
HMO model types are these:
- Group model HMO—A group model HMO is an HMO that contracts with a single multispecialty medical group to provide care to the HMO's membership. The group practice may work exclusively with the HMO, or it may provide services to non-HMO patients as well. The HMO pays the medical group a negotiated per capita rate, which the group distributes among its physicians, usually on a salaried basis.
- Staff model HMO—A staff model HMO is a closed-panel HMO (where patients can receive services only through a limited number of providers) in which physicians are HMO employees. The providers see members in the HMO's own facilities.
- Network model HMO—A network model HMO is an HMO that contracts with multiple physician groups to provide services to HMO members and may include single or multispecialty groups.
- Individual practice association (IPA)— An individual practice association is a healthcare provider organization composed of a group of independent practicing physicians who maintain their own offices and band together for the purpose of contracting their services to HMOs, preferred provider organizations (PPOs), and insurance companies. An IPA may contract with and provide services to both HMO and non-HMO plan participants.
- Mixed model HMO—A mixed model HMO combines features of more than one HMO model.
See related Managed care ; Point-of-service (POS) plan ; Preferred provider organization (PPO) .
Health services and supplies expenditures
Health status, respondent-assessed
Health status was measured in the National Health Interview Survey by asking the family respondent about his or her health or the health of a family member: "Would you say _____'s health is excellent, very good, good, fair, or poor?"
Hispanic origin
Hispanic or Latino origin includes persons of Mexican, Puerto Rican, Cuban, Central and South American, and other or unknown Latin American or Spanish origins. Persons of Hispanic origin may be of any race.
- National Health Interview Survey (NHIS) and National Health and Nutrition Examination Survey (NHANES)—Questions on Hispanic origin are self-reported in the NHANES III and subsequent years and all years of the NHIS and precede questions on race. The NHANES sample was designed to provide estimates specifically for persons of Mexican origin and not for all Hispanic-origin persons in the United States. Persons of Hispanic origin other than Mexicans were entered into the sample with different selection probabilities that are not nationally representative of the total U.S. Hispanic population.
- Birth File—The reporting area for an Hispanic-origin item on the birth certificate expanded between 1980 and 1993. Trend data on births of Hispanic and non-Hispanic parentage in this report are affected by expansion of the reporting area and by immigration. These two factors affect numbers of events, composition of the Hispanic population, and maternal and infant health characteristics.In 1980 and 1981, information on births of Hispanic parentage was reported on the birth certificate by the following 22 States: Arizona, Arkansas, California, Colorado, Florida, Georgia, Hawaii, Illinois, Indiana, Kansas, Maine, Mississippi, Nebraska, Nevada, New Jersey, New Mexico, New York, North Dakota, Ohio, Texas, Utah, and Wyoming. In 1982, Tennessee, and in 1983, the District of Columbia, began reporting this information. Between 1983 and 1987, information on births of Hispanic parentage was available for 23 States and the District of Columbia. In 1988, this information became available for Alabama, Connecticut, Kentucky, Massachusetts, Montana, North Carolina, and Washington, increasing the number of States reporting information on births of Hispanic parentage to 30 States and the District of Columbia. In 1989 this information became available from an additional 17 States, increasing the number of Hispanic-reporting States to 47 and the District of Columbia. In 1989, only Louisiana, New Hampshire, and Oklahoma did not report Hispanic parentage on the birth certificate. With the inclusion of Oklahoma in 1989 and Louisiana in 1990 as Hispanic-reporting States, 99 percent of birth records included information on mother's origin. Hispanic origin of the mother was reported on the birth certificates of 49 States and the District of Columbia in 1991 and 1992; only New Hampshire did not provide this information. Starting in 1993 Hispanic origin of mother was reported by all 50 States and the District of Columbia.
- Mortality File—The reporting area for an Hispanic-origin item on the death certificate expanded between 1985 and 1997. In 1985 mortality data by Hispanic origin of decedent were based on deaths to residents of the following 17 States and the District of Columbia whose data on the death certificate were at least 90 percent complete on a place-of-occurrence basis and of comparable format: Arizona, Arkansas, California, Colorado, Georgia, Hawaii, Illinois, Indiana, Kansas, Mississippi, Nebraska, New York, North Dakota, Ohio, Texas, Utah, and Wyoming. In 1986 New Jersey began reporting Hispanic origin of decedent, increasing the number of reporting States to 18 and the District of Columbia in 1986 and 1987. In 1988 Alabama, Kentucky, Maine, Montana, North Carolina, Oregon, Rhode Island, and Washington were added to the reporting area, increasing the number of States to 26 and the District of Columbia. In 1989 an additional 18 States were added, increasing the Hispanic reporting area to 44 States and the District of Columbia; only Connecticut, Louisiana, Maryland, New Hampshire, Oklahoma, and Virginia were not included in the reporting area. Starting with 1990 data in this book, the criterion was changed to include States whose data were at least 80 percent complete. In 1990 Maryland, Virginia, and Connecticut, in 1991 Louisiana, and in 1993 New Hampshire were added, increasing the reporting area for Hispanic origin of decedent to 47 States and the District of Columbia in 1990, 48 States and the District of Columbia in 1991 and 1992, and 49 States and the District of Columbia in 1993–96. Only Oklahoma did not provide this information in 1993–96. Starting in 1997 Hispanic origin of decedent was reported by all 50 States and the District of Columbia. Based on data from the U.S. Census Bureau, the 1990 reporting area encompassed 99.6 percent of the U.S. Hispanic population. In 1990 more than 96 percent of death records included information on Hispanic origin of decedent.
See related Race .
Home health care
Home health care as defined by the National Home and Hospice Care Survey is care provided by a home health care agency to individuals and families in their place of residence for promoting, maintaining, or restoring health or for minimizing the effects of disability and illness including terminal illness.
Home visit
Starting in 1997, the National Health Interview Survey has been collecting information on home visits received during the past 12 months. Respondents are asked "During the past 12 months, did you receive care at home from a nurse or other health care professional? What was the total number of home visits received?" These data are combined with data on visits to doctors' offices, clinics, and emergency departments to provide a summary measure of health care visits. See related Emergency department or emergency room visit ; Health care contact .
Hospice care
Hospice care as defined by the National Home and Hospice Care Survey is a program of palliative and supportive care services providing physical, psychological, social, and spiritual care for dying persons, their families, and other loved ones by a hospice program or agency. Hospice services are available in home and inpatient settings.
Hospital
According to the American Hospital Association, hospitals are licensed institutions with at least six beds whose primary function is to provide diagnostic and therapeutic patient services for medical conditions by an organized physician staff and that have continuous nursing services under the supervision of registered nurses. The World Health Organization considers an establishment to be a hospital if it is permanently staffed by at least one physician, can offer inpatient accommodation, and can provide active medical and nursing care. Hospitals may be classified by type of service, ownership, size in terms of number of beds, and length of stay. In the National Hospital Ambulatory Medical Care Survey, hospitals include all those with an average length of stay for all patients of less than 30 days (short-stay) or hospitals whose specialty is general (medical or surgical) or children's general. Federal hospitals and hospital units of institutions and hospitals with fewer than six beds staffed for patient use are excluded. See related Average length of stay ; Bed ; Days of care ; Emergency department ; Inpatient ; Outpatient department .
- Community hospitals—Community hospitals based on the American Hospital Association definition include all non-Federal short-term general and special hospitals whose facilities and services are available to the public. Special hospitals include obstetrics and gynecology; eye, ear, nose, and throat; rehabilitation; orthopedic; and other specialty services. Short-term general and special childrens hospitals are also considered to be community hospitals. A hospital may include a nursing-home-type unit and still be classified as short-term, provided that the majority of its patients are admitted to units where the average length of stay is less than 30 days. Hospital units of institutions such as prisons and college infirmaries that are not open to the public and are contained within a nonhospital facility are not included in the category of community hospitals. Traditionally the definition included all non-Federal short-stay hospitals except facilities for the mentally retarded. In a revised definition the following additional sites were excluded: hospital units of institutions, and alcoholism and chemical dependency facilities.
- Federal hospitals—Federal hospitals are operated by the Federal Government.
- For-profit hospitals—For-profit hospitals are operated for profit by individuals, partnerships, or corporations.
- General hospitals—General hospitals provide diagnostic, treatment, and surgical services for patients with a variety of medical conditions. According to the World Health Organization, these hospitals provide medical and nursing care for more than one category of medical discipline (e.g., general medicine, specialized medicine, general surgery, specialized surgery, and obstetrics). Excluded are hospitals, usually in rural areas, that provide a more limited range of care.
- Nonprofit hospitals—Nonprofit hospitals are controlled by nonprofit organizations, including religious organizations, fraternal societies, and others.
- Psychiatric hospitals—Psychiatric hospitals are ones whose major type of service is psychiatric care. See related Mental health organization.
- Registered hospitals—Registered hospitals are registered with the American Hospital Association. About 98 percent of hospitals are registered.
- Short-stay hospitals—Short-stay hospitals in the National Hospital Discharge Survey, are those in which the average length of stay is less than 30 days. The National Health Interview Survey defines a short-stay hospitals as any hospital or hospital department in which the type of service provided is general; maternity; eye, ear, nose, and throat; children's; or osteopathic.
- Specialty hospitals—Specialty hospitals such as psychiatric, tuberculosis, chronic disease, rehabilitation, maternity, and alcoholic or narcotic, provide a particular type of service to the majority of their patients.
Hospital-based physician
See Physician .
Hospital days
See Days of care .
Hospital utilization
Estimates of hospital utilization (such as hospital discharge rate, days of care rate, and average length of stay) presented in Health, United States are based on data from three different sources—the National Health Interview Survey (NHIS), the National Hospital Discharge Survey (NHDS), and the American Hospital Association. Estimates of hospital utilization from the NHIS and NHDS may differ because NHIS data are based on household interviews of the civilian noninstitutionalized population whereas NHDS data are based on hospital discharge records of all persons. Starting in 1997, hospital utilization data from the NHIS are for all hospital discharges whereas estimates for prior years excluded hospitalizations for delivery and newborns. NHDS includes hospital discharge records for all persons discharged alive or deceased and institutionalized persons and excludes data for newborn infants. Differences in hospital utilization estimated by these two surveys are particularly evident for children and the elderly. For children, NHIS estimates are higher than NHDS estimates because NHIS includes data for newborns. For the elderly NHDS estimates are higher than NHIS estimates because NHIS includes data for institutionalized persons and persons who died while hospitalized. Estimates for average length of stay between the three sources presented in Health, United States differ because of different methods for counting days of care. See related Average length of stay ; Days of care ; Discharge ; Appendix I , National Health Interview Survey, National Hospital Discharge Survey.
Human immunodeficiency virus (HIV) disease
HIV disease is a serious disease caused by a cytopathic retrovirus that is the cause of Acquired Immunity Syndrome (AIDS). It is also called AIDS-related virus, human T-cell leukemia virus type III, human T-cell lymphotrophic virus type III, and lymphadenopathy-associated virus. Mortality and morbidity coding for HIV disease are similar and have evolved over time.
- Mortality coding—Starting with data year 1999 and the introduction of the Tenth Revision of the International Classification of Diseases (ICD–10), the title for this cause of death was changed to "HIV disease" from "HIV infection" and the ICD codes changed to B20–B24. Beginning with data for 1987, NCHS introduced category numbers *042–*044 for classifying and coding HIV infection as a cause of death in ICD–9. The asterisk before the category numbers indicates that these codes were not part of the original ICD–9. HIV infection was formerly referred to as human T-cell lymphotropic virus-III/lymphadenopathy-associated virus (HTLV-III/LAV) infection. Before 1987 deaths involving HIV infection were classified to Deficiency of cell-mediated immunity (ICD–9 279.1) contained in the title "All other diseases"; to Pneumocystosis (ICD–9 136.3) contained in the title "All other infectious and parasitic diseases"; to "Malignant neoplasms, including neoplasms of lymphatic and hematopoietic tissues"; and to a number of other causes. Therefore, before 1987, death statistics for HIV infection are not strictly comparable with data for 1987 and later years and are not shown in this report.
- Morbidity coding—The National Hospital Discharge Survey codes diagnosis data using the International Classification of Diseases, Ninth Revision, Clinical Modification (ICD–9–CM). Discharges with diagnosis of HIV as shown in Health, United States have at least one HIV diagnosis listed on the face sheet of the medical record and are not limited to the first-listed diagnosis. During 1984 and 1985 only data for AIDS (ICD–9–CM 279.19) were included. In 1986–94 discharges with the following diagnoses were included: Acquired immunodeficiency syndrome (AIDS), Human immunodeficiency virus (HIV) infection and associated conditions, and Positive serological or viral culture findings for HIV (ICD–9–CM 042–044, 279.19, and 795.8). Beginning in 1995 discharges with the following diagnoses were included: Human immunodeficiency virus (HIV) disease and Asymptomatic human immunodeficiency virus (HIV) infection status (ICD–9–CM 042 and V08).
See related Acquired immunodeficiency syndrome (AIDS) ; Cause of death ; International Classification of Diseases (ICD) ; International Classification of Diseases, Ninth Revision, Clinical Modification (ICD–9–CM) .
I
ICD; ICD codes
See Cause of death ; International Classification of Diseases (ICD) .
Illicit drug use
Illicit drug use refers to use and misuse of illegal and controlled drugs.
- Monitoring the Future Study—In this school-based survey of secondary school students, information on marijuana use is collected using self-completed questionnaires. The information is based on the following questions: "On how many occasions (if any) have you used marijuana in the last 30 days?" and "On how many occasions (if any) have you used hashish in the last 30 days?" Questions on cocaine use include the following: "On how many occasions (if any) have you take 'crack' (cocaine in chunk or rock form) during the last 30 days?" and "On how many occasions (if any) have you taken cocaine in any other form during the last 30 days?"
- National Survey on Drug Use & Health (NSDUH)—Information on illicit drug use is collected for all persons 12 years of age and over. Information on any illicit drug use, including marijuana or hashish, cocaine, heroin, hallucinogens, and nonmedical use of prescription drugs is based on the following question: "During the past 30 days, on how many days did you use (specific illicit drug)?" See related Substance use .
Incidence
Incidence is the number of cases of disease having their onset during a prescribed period of time. It is often expressed as a rate (e.g., the incidence of measles per 1,000 children 5–15 years of age during a specified year). Incidence is a measure of morbidity or other events that occur within a specified period of time. See related Prevalence .
Income
See Family income .
Individual practice association (IPA)
Industry of employment
Industries are classified according to the 2002 North American Industry Classification System (NAICS) for the presentation of health data in Health, United States, starting with data year 2003. The NAICS classification system groups establishments into industries based on their production or supply function—establishments using similar raw material inputs, capital equipment, and labor are classified in the same industry. This approach creates homogeneous categories well suited for economic analysis. NAICS uses a six-digit hierarchical coding system to classify all economic activity into 20 industry sectors. The first two digits of the six-digit code designate the highest level of aggregation, with 20 such two-digit industry sectors (table VIII). Five sectors are primarily goods-producing sectors, and 15 are entirely services-providing sectors. NAICS allows for the classification of 1,170 industries.
NAICS replaces the Standard Industrial Classification (SIC) system, originally designed in the 1930s and revised and updated periodically to reflect changes in the U.S. economy. The last SIC revision was in 1987. The SIC system focused on the manufacturing sector of the economy and provided significantly less detail for the now dominant service sector, including newly developed industries in information services, health care delivery, and high-tech manufacturing. Although some titles in SIC and NAICS are similar, there is little comparability between the two systems because industry groupings are defined differently.
Starting with Health United States, 2005, health data by industry from the Bureau of Labor Statistics' Census of Fatal Occupational Injuries (CFOI) and Survey of Occupational Injuries and Illnesses (SOII) data systems are classified using the NAICS system and replace trends in occupational health data based on the SIC system in previous editions of Health, United States. With 2003 data in which industries are classified by NAICS system, CFOI and SOII start a new trend, and the estimates of deaths, injuries, and illnesses by industry should not be compared with earlier estimates that used the SIC.
Infant death
An infant death is the death of a live-born child before his or her first birthday. Age at death may be further classified according to neonatal and postneonatal. Neonatal deaths are those that occur before the 28th day of life; postneonatal deaths are those that occur between 28 and 365 days of age. See related Rate: Death and related rates .
Injury
The International Classification of External Causes of Injuries (ICECI) Coordination and Maintenance Group defines injury as a (suspected) bodily lesion resulting from acute overexposure to energy (this can be mechanical, thermal, electrical, chemical, or radiant) interacting with the body in amounts or rates that exceed the threshold of physiological tolerance. In some cases an injury results from an insufficiency of any of the vital elements. Acute poisonings and toxic effects, including overdoses of substances and wrong substances given or taken in error are included, as are adverse effects and complications of therapeutic, surgical, and medical care. Psychological harm is excluded. Injuries can be intentional or unintentional (i.e., accidental). External causes of nonfatal injuries in NCHS data systems are coded to the International Classification of Diseases, Ninth Revision, Clinical Modification Supplementary Classification of External Causes of Injury and Poisoning, often referred to as "E-Codes." See table VII for a list of injury categories and codes. See related Diagnosis ; Injury-related visit . See ICECI Coordination and Maintenance Group (2004). International Classification of External Causes of Injuries (ICECI), version 1.2. Consumer Safety Institute, Amsterdam and AIHW National Injury Surveillance Unit, Adelaide, found at www.iceci.org.
Injury-related visit
In the National Hospital Ambulatory Medical Care Survey an emergency department visit was considered injury related if, on the Patient Record Form (PRF), the checkbox for injury was indicated. In addition, injury visits were identified if the physician's diagnosis was injury related (ICD–9–CM code of 800–999), an external cause-of-injury code was present (ICD–9–CM E800–E999), or the patient's reason for visit code was injury-related. See related Emergency department or emergency room visit ; External cause of injury ; Injury .
Inpatient
An inpatient is a person who is formally admitted to the inpatient service of a hospital for observation, care, diagnosis, or treatment. See related Admission ; Average length of stay ; Days of care ; Discharge ; Hospital .
Inpatient care
Inpatient days
See Days of care .
Instrumental activities of daily living (IADL)
Instrumental activities of daily living are activities related to independent living and include preparing meals, managing money, shopping for groceries or personal items, performing light or heavy housework, and using a telephone. In the National Health Interview Survey (NHIS) respondents are asked whether they or family members 18 years of age and over need the help of another person for handling routine IADL needs because of a physical, mental, or emotional problem. Persons are considered to have an IADL limitation in the NHIS if any causal condition is chronic.
In the Medicare Current Beneficiary Survey, if a sample person had any difficulty performing an activity by him or herself and without special equipment, or did not perform the activity at all because of health problems, the person was categorized as having a limitation in that activity. The limitation may have been temporary or chronic at the time of the interview. Sample persons in the community answered health status and functioning questions themselves, if able to do so. For sample persons in a long-term care facility, a proxy such as a nurse answered questions about the sample person's health status and functioning. See related Activities of daily living (ADL) ; Limitation of activity .
Insured
Intermediate care facilities
See Nursing home .
International Classification of Diseases (ICD)
The ICD provides the ground rules for coding and classifying cause-of-death data. The ICD is developed collaboratively by the World Health Organization (WHO) and 10 international centers, one of which is housed at NCHS. The purpose of the ICD is to promote international comparability in the collection, classification, processing, and presentation of health statistics. Since 1900, the ICD has been modified about once every 10 years, except for the 20-year interval between ICD–9 and ICD–10 (see table IV). The purpose of the revisions is to stay abreast with advances in medical science. New revisions usually introduce major disruptions in time series of mortality statistics (see tables V and VI). For more information, see www.cdc.gov/nchs/about/major/dvs/icd10des.htm. See related Cause of death ; Comparability ratio ; International Classification of Diseases, Ninth Revision, Clinical Modification (ICD–9–CM).
International Classification of Diseases, Ninth Revision, Clinical Modification (ICD–9–CM)
The ICD–9–CM is based on and is compatible with the World Health Organization's International Classification of Diseases, Ninth Revision (ICD–9). The United States currently uses ICD–9–CM to code morbidity diagnoses and inpatient procedures. ICD–9–CM consists of three volumes. Volumes 1 and 2 contain the diagnosis tabular list and index. Volume 3 contains the procedure classification (tabular and index combined).
ICD–9–CM is divided into 17 chapters and 2 supplemental classifications. The chapters are arranged primarily by body system. In addition, there are chapters for Infectious and parasitic diseases; Neoplasms; Endocrine, nutritional, and metabolic diseases; Mental disorders; Complications of pregnancy, childbirth and puerperium; Certain conditions originating in the perinatal period; Congenital anomalies; and Symptoms, signs and ill-defined conditions. The two supplemental classifications are for factors influencing health status and contact with health services ("V Codes"), and external causes of injury and poisoning ("E Codes").
In Health, United States morbidity data are classified using ICD–9–CM. Diagnostic categories and codes for ICD–9–CM are shown in table IX; ICD–9–CM procedure categories and codes are shown in table X. For additional information about ICD–9–CM, see www.cdc.gov/nchs/icd9.htm. See related International Classification of Diseases (ICD).
L
Late fetal death rate
Leading causes of death
See Cause-of-death ranking .
Length of stay
See Average length of stay .
Life expectancy
Life expectancy is the average number of years of life remaining to a person at a particular age and is based on a given set of age-specific death rates, generally the mortality conditions existing in the period mentioned. Life expectancy may be determined by race, sex, or other characteristics using age-specific death rates for the population with that characteristic. See related Rate: Death and related rates .
Limitation of activity
Limitation of activity may be defined different ways, depending on the conceptual framework. In the National Health Interview Survey limitation of activity refers to a long-term reduction in a person's capacity to perform the usual kind or amount of activities associated with his or her age group as a result of a chronic condition. Limitation of activity is assessed by asking persons a series of questions about limitations in their or household members' ability to perform activities usual for their age group because of a physical, mental, or emotional problem. Persons are asked about limitations in activities of daily living, instrumental activities of daily living, play, school, work, difficulty walking or remembering, and any other activity limitations. For reported limitations, the causal health conditions are determined, and persons are considered limited if one or more of these conditions is chronic. Children under 18 years of age who receive special education or early intervention services are considered to have a limitation of activity. See related Activities of daily living ; Condition ; Instrumental activities of daily living .
Live-birth order
In the National Vital Statistics System, this item from the birth certificate refers to the total number of live births the mother has had, including the present birth as recorded on the birth certificate. Fetal deaths are excluded.
Long-term care facility
A long-term care facility is a residence that provides a specific level of personal or medical care or supervision to residents. In the Medicare Current Beneficiary Survey, a residence is considered a long-term care facility if it has three or more long-term care beds and provides personal care services to residents, continuous supervision of residents, or long-term care services throughout the facility or in a separately identifiable unit. Types of long-term care facilities include licensed nursing homes, skilled nursing homes, intermediate care facilities, retirement homes (that provide services), domiciliary or personal care facilities, distinct long-term care units in a hospital complex, mental health facilities and centers, assisted and foster care homes, and institutions for the mentally retarded and developmentally disabled. See related Nursing home .
Low birthweight
See Birthweight .
M
Mammography
Mammography is an x-ray image of the breast used to detect irregularities in breast tissue. In the National Health Interview Survey, questions concerning use of mammography were asked on an intermittent schedule, and question content differed slightly across years. In 1987 and 1990, women were asked to report when they had their last mammogram. In 1991, women were asked whether they had a mammogram in the past 2 years. In 1993 and 1994, women were asked whether they had a mammogram within the past year, between 1 and 2 years ago, or over 2 years ago. In 1998, women were asked whether they had a mammogram a year ago or less, more than 1 year but not more than 2 years, or more than 2 years ago. In 1999, women were asked when they had their most recent mammogram in days, weeks, months, or years. In 1999, 10 percent of women in the sample responded "2 years ago," and in this analysis these women were coded as "within the past 2 years" although a response of "2 years ago" may include women whose last mammogram was more than 2 but less than 3 years ago. Thus, estimates for 1999 are overestimated to some degree in comparison with estimates in previous years. In 2000 and 2003, women were asked when they had their most recent mammogram (give month and year). Women who did not respond were given a followup question that used the 1999 wording, and women who did not answer the followup question were asked a second followup question that used the 1998 wording. In 2000 and 2003, 2 percent of women in the sample answered "2 years ago" using the 1999 wording, and they were coded as "within the past 2 years." Thus, estimates for 2000 and 2003 may be slightly overestimated in comparison with estimates for years prior to 1999.
Managed care
Managed care is a term originally used to refer to the prepaid health care sector (health maintenance organizations or HMOs) where care is provided under a fixed budget and costs are therein capable of being managed. Increasingly, the term is being used to include preferred provider organizations (PPOs) and even forms of indemnity insurance coverage (or fee-for-service insurance) that incorporate preadmission certification and other utilization controls. See related Health maintenance organization (HMO) ; Preferred provider organization (PPO) .
Marital status
Marital status is classified through self-reporting into the categories married and unmarried. The term "married" encompasses all married people including those separated from their spouses. Unmarried includes those who are single (never married), divorced, or widowed. The abortion surveillance program classified separated people as unmarried before 1978.
- Birth File—In 1970, 39 States and the District of Columbia (DC) and in 1975, 38 States and DC included a direct question about mother's marital status on the birth certificate. Since 1980, national estimates of births to unmarried women have been based on two methods for determining marital status, a direct question in the birth registration process and inferential procedures. In 1980–96 marital status was reported on the birth certificates of 41–45 States and DC; with the addition of California in 1997, 46 States and DC; and in 1998–2001, 48 States and DC. In 1997, all but four States (Connecticut, Michigan, Nevada, and New York), and in 1998, all but two States (Michigan and New York) included a direct question about mother's marital status on their birth certificates. In 1998–2001, marital status was imputed as married on those 0.03–0.05 percent of birth records with missing information in the 48 States and DC where this information was obtained by a direct question.For States lacking a direct question, marital status was inferred. Before 1980 the incidence of births to unmarried women in States with no direct question on marital status was assumed to be the same as the incidence in reporting States in the same geographic division. Starting in 1980 for States without a direct question, marital status was inferred by comparing the parents' and child's surnames. Inferential procedures in current use depend on the presence of a paternity acknowledgment or missing information on the father. Changes in reporting procedures by some States in 1995 and 1997 had little effect on national totals, but they did affect trends for age groups and some State trends. Details of the changes in reporting procedures are described in Ventura SJ, Bachrach CA. Nonmarital Childbearing in the United States, 1940–99. National vital statistics reports; vol 48 no 16. Hyattsville, MD: National Center for Health Statistics. 2000, available at www.cdc.gov/nchs/births.htm.
Maternal age
See Age .
Maternal death
Maternal death is defined by the World Health Organization as the death of a woman while pregnant or within 42 days of termination of pregnancy, irrespective of the duration and site of the pregnancy, from any cause related to or aggravated by the pregnancy or its management, but not from accidental or incidental causes. A maternal death is one for which the certifying physician has designated a maternal condition as the underlying cause of death. Maternal conditions are those assigned to pregnancy, childbirth, and the puerperium, ICD–10 codes A34, O00–O95, O98–O99 (see table V). Changes have been made in the classification and coding of maternal deaths between ICD–9 and ICD–10, effective with mortality data for 1999. ICD–10 changes pertain to indirect maternal causes and timing of death relative to pregnancy. If only indirect maternal causes of death (i.e., a previously existing disease or a disease that developed during pregnancy that was not due to direct obstetric causes but was aggravated by physiologic effects of pregnancy) are reported in Part I of the death certificate and pregnancy is reported in either Part I or Part II, ICD–10 classifies this as a maternal death. ICD–9 only classified the death as maternal if pregnancy was reported in Part I. Some State death certificates include a separate question regarding pregnancy status. A positive response to the question is interpreted as "pregnant" being reported in Part II of the cause-of-death section of the death certificate. If the medical certifier did not specify when death occurred relative to the pregnancy, it is assumed that the pregnancy terminated 42 days or less prior to death. Under ICD–10, a new category has been added for deaths from maternal causes that occurred more than 42 days after delivery or termination of pregnancy (O96–O97). In 1999, there were 15 such deaths, and, in 2000, there were eight. See related Rate: Death and related rates .
Maternal education
See Education .
Maternal mortality rate
Medicaid
Medicaid was authorized by Title XIX of the Social Security Act in 1965 as a jointly funded cooperative venture between the Federal and State Governments to assist States in the provision of adequate medical care to eligible needy persons. Within broad Federal guidelines, each of the States establishes its own eligibility standards; determines the type, amount, duration, and scope of services; sets the rate of payment for services; and administers its own program. Medicaid is the largest program providing medical and health-related services to America's poorest people. However, Medicaid does not provide medical assistance to all poor persons. Under the broadest provisions of the Federal statute, Medicaid does no provide health care services even for very poor childless adults under age 65 years unless they are disabled. Except as noted, all States must provide Medicaid coverage to the following:
- Individuals who meet the requirements for the Aid to Families with Dependent Children (AFDC) program that were in effect in their State on July 16, 1996, or, at State option, more liberal criteria (with some exceptions).
- Children under age 6 whose family income is at or below 133 percent of the Federal poverty level.
- Pregnant women whose family income is below 133 percent of the Federal poverty level (services to these women are limited to those related to pregnancy, complications of pregnancy, delivery, and postpartum care).
- Supplemental Security Income (SSI) recipients in most States (some States use more restrictive Medicaid eligibility requirements that predate SSI).
- Recipients of adoption or foster care assistance under Title IV of the Social Security Act.
- Special protected groups (typically individuals who lose their cash assistance because of earnings from work or from increased Social Security benefits but who may keep Medicaid for a period of time).
- All children under age 19 in families with incomes at or below the Federal poverty level.
- Certain Medicare beneficiaries (low income is only one test for Medicaid eligibility for those within these groups; their resources also are tested against threshold levels, as determined by each State within Federal guidelines).
States also have the option of providing Medicaid coverage for other groups.
Medicaid operates as a vendor payment program. States may pay health care providers directly on a fee-for-service basis, or States may pay for Medicaid services through various prepayment arrangements, such as health maintenance organizations (HMOs) or other forms of managed care. Within Federally imposed upper limits and specific restrictions, each State for the most part has broad discretion in determining the payment methodology and payment rate for services. Thus, the Medicaid program varies considerably from State to State, as well as within each State over time. See related Health expenditures, national ; Health insurance coverage ; Health maintenance organization (HMO) ; Managed care ; Appendix I , Medicaid Data System.
Medical specialties
See Physician specialty .
Medical vendor payments
Under the Medicaid program, medical vendor payments are payments (expenditures) to medical vendors from the State through a fiscal agent or to a health insurance plan. Adjustments are made for Indian Health Service payments to Medicaid, cost settlements, third party recoupments, refunds, voided checks, and other financial settlements that cannot be related to specific provided claims. Excluded are payments made for medical care under the emergency assistance provisions, payments made from State medical assistance funds that are not federally matchable, disproportionate share hospital payments, cost sharing or enrollment fees collected from recipients or a third party, and administration and training costs.
Medicare
This is a nationwide health insurance program providing health insurance protection to people 65 years of age and over, people entitled to Social Security disability payments for 2 years or more, and people with end-stage renal disease, regardless of income. The program was enacted July 30, 1965, as Title XVIII, Health Insurance for the Aged of the Social Security Act, and became effective on July 1, 1966. From its inception, it has included two separate but coordinated programs: hospital insurance (Part A) and supplementary medical insurance (Part B). In 1999, additional choices were allowed for delivering Medicare Part A and Part B benefits. "Medicare+Choice" (Part C) is an expanded set of options for the delivery of health care under Medicare, created in the Balanced Budget Act passed by Congress in 1997. The term "Medicare+Choice" refers to options other than original Medicare. While all Medicare beneficiaries can receive their benefits through the original fee-for-service (FFS) program, most beneficiaries enrolled in both Part A and Part B can choose to participate in a Medicare+Choice plan instead. Organizations that seek to contract as Medicare+Choice plans must meet specific organizational, financial, and other requirements. Most Medicare+Choice plans are coordinated care plans, which include health maintenance organizations (HMOs), provider-sponsored organizations (PSOs), preferred provider organizations (PPOs), and other certified coordinated care plans and entities that meet the standards set forth in the law. The Medicare+Choice program also includes Medical savings account (MSA) plans, which provide benefits after a single high deductible is met, and private, unrestricted FFS plans, which allow beneficiaries to select certain private providers. These programs are available in only a limited number of States. For those providers who agree to accept the plan's payment terms and conditions, this option does not place the providers at risk, nor does it vary payment rates based on utilization. Only the coordinated care plans are considered managed care plans. Except for MSA plans, all Medicare+Choice plans are required to provide at least the current Medicare benefit package, excluding hospice services. Plans may offer additional covered services and are required to do so (or return excess payments) if plan costs are lower than the Medicare payments received by the plan.
In the National Health Interview Survey (NHIS), the category "Medicare HMO" is defined as persons who are age 65 years or over and who responded "Yes" when asked whether they were under a Medicare managed care arrangement such as an HMO. This is a subset of Medicare Part C. Respondents who stated they had Medicare coverage but did not answer yes to the "managed care arrangement such as an HMO" are included in the Medicare fee-for-service category. "Medicare fee-for-service" is defined as Medicare Part A or Part B. The majority of these people had coverage from another source, primarily employer-sponsored retiree health insurance. Some tables in Health, United States further classify persons 65 years of age and over with Medicare fee-for service into Medicare fee-for-service only and Private (including Medicare fee-for-service) coverage.
See related Fee-for-service health insurance ; Health insurance coverage ; Health maintenance organization (HMO) ; Managed care ; Appendix I , Medicare Administrative Data.
Mental health organization
The Center for Mental Health Services of the Substance Abuse and Mental Health Services Administration defines a mental health organization as an administratively distinct public or private agency or institution whose primary concern is provision of direct mental health services to the mentally ill or emotionally disturbed. Excluded are private office-based practices of psychiatrists, psychologists, and other mental health providers; psychiatric services of all types of hospitals or outpatient clinics operated by Federal agencies other than the Department of Veterans Affairs (e.g., Public Health Service, Indian Health Service, Department of Defense, and Bureau of Prisons); general hospitals that have no separate psychiatric services but admit psychiatric patients to nonpsychiatric units; and psychiatric services of schools, colleges, halfway houses, community residential organizations, local and county jails, State prisons, and other human services providers. The major types of mental health organizations are described below.
- Freestanding psychiatric outpatient clinics—These clinics provide only outpatient mental health services on either a regular or emergency basis. A psychiatrist generally assumes the medical responsibility for services.
- Psychiatric hospitals—These hospitals (public or private) primarily provide 24-hour inpatient care and treatment in a hospital setting to persons with mental illnesses. Psychiatric hospitals may be under State, county, private for profit, or private nonprofit auspices.
- General hospital psychiatric services—These are organizations that provide psychiatric services with assigned staff for 24-hour inpatient or residential care and/or less than 24-hour outpatient care in a separate ward, unit, floor, or wing of the hospital.
- Department of Veterans Affairs medical centers—These are hospitals are hospitals operated by the Department of Veterans Affairs (formerly Veterans Administration) and include Department of Veterans Affairs general hospital psychiatric services (including large neuropsychiatric units) and Department of Veterans Affairs psychiatric outpatient clinics.
- Residential treatment centers for emotionally disturbed children—These centers must meet all of the following criteria: (a) provide 24-hour residential services; (b) are not licensed as a psychiatric hospital and have the primary purpose of providing individually planned mental health treatment services in conjunction with residential care; (c) include a clinical program directed by a psychiatrist, psychologist, social worker, or psychiatric nurse with a graduate degree; (d) serve children and youth primarily under the age of 18; and (e) have the primary diagnosis as mental illness, classified as other than mental retardation, developmental disability, or substance-related disorders, according to DSM-II/ICDA-8 or DSM-IIIR/ICD–9–CM codes, for the majority of admissions.
- Multiservice mental health organizations—These organizations provide services in both 24-hour and less than 24-hour settings and are not classifiable as a psychiatric hospital, general hospital, or residential treatment center for emotionally disturbed children. (The classification of a psychiatric or general hospital or residential treatment center for emotionally disturbed children takes precedence over a multiservice classification, even if two or more services are offered.)
- Partial care organizations—These organizations provide a program of ambulatory mental health services or rehabilitation, habitation, or education programs.
See related Addition; Mental health service type .
Mental health service type
This term refers to the following types of mental health services:
- 24-hour mental health care, formerly called inpatient care, provides care in a mental health hospital setting.
- Less than 24-hour care, formerly called outpatient or partial care treatment, provides mental health services on an ambulatory basis.
- Residential treatment care provides overnight mental health care in conjunction with an intensive treatment program in a setting other than a hospital. Facilities may offer care to emotionally disturbed children or mentally ill adults.
See related Addition ; Mental health organization .
Metropolitan statistical area (MSA)
The Office of Management and Budget (OMB) defines metropolitan areas according to published standards that are applied to Census Bureau data. An MSA is a county or group of contiguous counties that contains at least one urbanized area of 50,000 or more population. In addition to the county or counties that contain all or part of the urbanized area, an MSA may contain other counties that are metropolitan in character and that are economically and socially integrated with the main city. In New England, cities and towns, rather than counties, are used to define MSAs. Counties that are not within an MSA are considered to be nonmetropolitan.
For National Health Interview Survey (NHIS) data before 1995, metropolitan population is based on MSAs as defined by OMB in 1983 using the 1980 census. Starting with the 1995 NHIS, metropolitan population is based on MSAs as defined by OMB in 1993 using the 1990 census. For additional information about metropolitan statistical areas see www.census.gov/population/www/estimates/metrodef.html. See related Urbanization .
Micropolitan statistical area
The Office of Management and Budget (OMB) defines micropolitan areas based on published standards that are applied to Census Bureau data. A micropolitan statistical area is a nonmetropolitan county or group of contiguous nonmetropolitan counties that contains an urban cluster of 10,000 to 49,999 persons. A micropolitan statistical area may include surrounding counties if there are strong economic ties between the counties, based on commuting patterns. In New England, cities and towns, rather than counties, are used to define micropolitan statistical areas. Nonmetropolitan counties that are not classified as part of a micropolitan statistical area are considered nonmicropolitan. For additional information about micropolitan statistical areas see www.census.gov/population/www/estimates/metrodef.html. See related Urbanization .
Multiservice mental health organizations
N
National Drug Code (NDC) Directory therapeutic class
The NDC system was originally established as an essential part of an out-of-hospital drug reimbursement program under Medicare. The NDC serves as a universal product identifier for human drugs. The current edition of the NDC is limited to prescription drugs and a few selected over-the-counter (OTC) products. The directory consists of prescription and selected OTC insulin, domestic, and foreign drug products that are in commercial distribution in the United States. The products have been listed in accordance with the Drug Listing Act and applicable Code of Federal Regulations for submitting drug product information to the Food and Drug Administation (FDA). NDC therapeutic class codes are used to identify each of 20 major drug classes to which the drug entry may belong, adapted from Standard Drug Classifications in the NDC Directory, 1995. The two-digit categories are general and represent all subcategories (e.g., Antimicrobial agents), and the specific four-digit categories represent the breakouts of the general category (e.g., Penicillin). The general two-digit codes include medications that do not fit into any of the subcategories (four-digit codes). Starting in 1995, the NDC four-digit classes were changed to include more classes than the previous classification in 1985. Therefore some drugs switched from a general two-digit class into a more specific four-digit class. In addition, drugs may be approved for several different therapeutic classes. Some drugs receive approval for additional therapeutic uses after their initial approval, so the same drug can change classes because of new uses.
Numerous drug products have many uses or indications. In an effort to categorize the vast number of the broad analgesic or pain-relief individual products in the marketplace into manageable and nonoverlapping categories, all four-digit categories within the analgesic two-digit therapeutic class were recoded by staff of the FDA's Center for Drug Center for Drug Evaluation and Research. Thus, the codes presented in Health, United States do not match the published NDC codes for analgesic therapeutic categories. The NDC contains the following four-digit analgesic therapeutic categories: 1720—general analgesic, 1721—narcotic analgesic, 1722—nonnarcotic analgesic, 1724—antiarthritics, 1723—antimigraine/headache, 1726—central pain syndrome, 1727—nonsteroidal anti-inflammatory drugs (NSAID), 1728—antipyretic, and 1729—menstrual products. These categories were collapsed into broader and mutually exclusive categories of narcotic analgesics, nonnarcotic analgesics, and NSAIDs. Under the NDC system, aspirin is coded as an NSAID because of its anti-inflammatory properties, but also as an analgesic, an antiarthritic, and an antipyretic. In this report aspirin has been recoded into the nonnarcotic analgesic category. Aspirin was not included as an NSAID because of its common use for cardiac therapy and its many other indications.
Table XI shows how generic analgesic drugs were reclassified for Health, United States. Analgesic drugs were reclassified based on the product's main ingredients or indication of use. For example, Robitussin AC contains several ingredients, one of which is codeine, a narcotic. However, its main use is not for pain but for cough suppression, and it is therefore categorized as a cough and cold product as opposed to a narcotic analgesic product. Another example is methotrexate, which is used for treating certain neoplastic diseases and severe psoriasis in some formulations, but it is also used to treat rheumatoid arthritis and therefore appears in the list of nonnarcotic analgesic drugs, which include previously defined antiarthritic drugs in table XI.
Neonatal mortality rate
Nonpatient revenues
Nonpatient revenues are those revenues received for which no direct patient care services are rendered. The most widely recognized source of nonpatient revenues is philanthropy. Philanthropic support may be direct from individuals or may be obtained through philanthropic fundraising organizations, foundations, or corporations. Philanthropic revenues may be designated for direct patient care use or may be contained in an endowment fund where only the current income may be tapped.
Nonprofit hospitals
See Hospital .
North American Industry Classification System (NAICS)
See Industry of employment .
Notifiable disease
A notifiable disease is one that, when diagnosed, health providers are required, usually by law, to report to State or local public health officials. Notifiable diseases are those of public interest by reason of their contagiousness, severity, or frequency.
Nurse supply estimates
Nurse supply estimates are based on a model developed by Health Resources and Services Administration's (HRSA's) Bureau of Health Professions to meet the requirements of Section 951, P.L. 94–63. The model estimates the following for each State: (a) population of nurses currently licensed to practice; (b) supply of full-time and part-time practicing nurses (or available to practice); and (c) full-time equivalent supply of nurses practicing full-time plus one-half of those practicing part-time (or available on that basis). The three estimates are divided into three levels of highest educational preparation—associate degree or diploma, baccalaureate, and master's and doctorate. Among the factors considered are new graduates, changes in educational status, nursing employment rates, age, migration patterns, death rates, and licensure phenomena. The base data for the model are derived from the National Sample Surveys of Registered Nurses, conducted by the Division of Nursing, Bureau of Health Professions, HRSA. Other data sources include National League for Nursing for data on nursing education and National Council of State Boards of Nursing for data on licensure. For further information, see HRSA's Division of Nursing Web site at www.bhpr.hrsa.gov/nursing.
Nursing care
The following definition of nursing care applies to data collected in National Nursing Home Surveys through 1977. Nursing care is provision of any of the following services: application of dressings or bandages; bowel and bladder retraining; catheterization; enema; full bed bath; hypodermic, intramuscular, or intravenous injection; irrigation; nasal feeding; oxygen therapy; and temperature-pulse-respiration or blood pressure measurement. See related Nursing home .
Nursing care homes
See Nursing home .
Nursing home
In the Online Survey Certification and Reporting database, a nursing home is a facility that is certified and meets the Center for Medicare & Medicaid Services' long-term care requirements for Medicare and Medicaid eligibility.
In the National Master Facility Inventory (NMFI), which provided the sampling frame for 1973–74, 1977, and 1985 National Nursing Home Surveys, a nursing home was an establishment with three or more beds that provided nursing or personal care services to the aged, infirm, or chronically ill. The 1977 National Nursing Home Survey included personal care homes and domiciliary care homes, whereas the National Nursing Home Surveys of 1973–74, 1985, 1995, 1997, and 1999 excluded them. The following definitions of nursing home types applied to facilities listed in the NFMI:
- Nursing care homes—These homes employ one or more full-time registered or licensed practical nurses and provide nursing care to at least one-half the residents.
- Personal care homes with nursing—These homes have fewer than one-half the residents receiving nursing care. In addition, such homes employ one or more registered or licensed practical nurses or provided administration of medications and treatments in accordance with physicians' orders, supervision of self-administered medications, or three or more personal services.
- Personal care homes without nursing—These homes have no residents who receive nursing care. These homes provide administration of medications and treatments in accordance with physicians' orders, supervise self-administered medications, or provide three or more personal services.
- Domiciliary care homes—These homes primarily provide supervisory care and one or two personal services.
The following definitions of certification levels apply to data collected in National Nursing Home Surveys of 1973–74, 1977, and 1985:
- Skilled nursing facilities—These facilities provide the most intensive nursing care available outside a hospital. Facilities certified by Medicare provide posthospital care to eligible Medicare enrollees. Facilities certified by Medicaid as skilled nursing facilities provide skilled nursing services on a daily basis to individuals eligible for Medicaid benefits.
- Intermediate care facilities—These facilities are certified by the Medicaid program to provide health-related services on a regular basis to Medicaid eligibles who do not require hospital or skilled nursing facility care but do require institutional care above the level of room and board.
- Not certified facilities—These facilities are not certified as providers of care by Medicare or Medicaid.
Beginning with the 1995 National Nursing Home Surveys, nursing homes have been defined as facilities that routinely provide nursing care services and have three or more beds set up for residents. Facilities may be certified by Medicare or Medicaid or not certified but licensed by the State as a nursing home. The facilities may be freestanding or a distinct unit of a larger facility.
After October 1, 1990, long-term care facilities that met the Omnibus Budget Reconciliation Act of 1987 (OBRA 87) nursing home reform requirements that were formerly certified under the Medicaid program as skilled nursing, nursing home, or intermediate care facilities were reclassified as nursing facilities. The Medicare program continues to certify skilled nursing facilities, but not intermediate care facilities. State Medicaid programs can certify intermediate care facilities for the mentally retarded or developmentally disabled. Nursing facilities must also be certified to participate in the Medicare program to be certified for participation in Medicaid except those facilities that have obtained waivers. Thus most nursing home care is now provided in skilled care facilities.
See related Long-term care facility ; Nursing care ; Resident .
Nursing home expenditures
O
Obesity
Occupancy rate
In American Hospital Association statistics, hospital occupancy rate is calculated as the average daily census divided by the number of hospital beds, cribs, and pediatric bassinets set up and staffed on the last day of the reporting period, expressed as a percent. Average daily census is calculated by dividing the total annual number of inpatients, excluding newborns, by 365 days to derive the number of inpatients receiving care on an average day during the annual reporting period. The occupancy rate for facilities other than hospitals is calculated as the number of residents at the facility reported on the day of the interview divided by the number of reported beds. In the Online Survey Certification and Reporting database, occupancy is determined as of the day of certification inspection as the total number of residents on that day divided by the total number of beds on that day.
Office
In the National Ambulatory Medical Care Survey, a physician's ambulatory practice (office) can be in any location other than in a hospital, nursing home, other extended care facility, patient's home, industrial clinic, college clinic, or family planning clinic. Offices in health maintenance organizations and private offices in hospitals are included. See related Office visit ; Outpatient visit ; Physician .
Office-based physician
See Physician .
Office visit
In the National Ambulatory Medical Care Survey, an office visit is any direct personal exchange between an ambulatory patient and a physician or members of his or her staff for the purposes of seeking care and rendering health services. See related Outpatient visit .
Operations
See Procedure .
Outpatient department
According to the National Hospital Ambulatory Medical Care Survey (NHAMCS), an outpatient department (OPD) is a hospital facility where nonurgent ambulatory medical care is provided. The following types of OPDs are excluded from the NHAMCS: ambulatory surgical centers, chemotherapy, employee health services, renal dialysis, methadone maintenance, and radiology. See related Emergency department ; Outpatient visit .
Outpatient surgery
According to the American Hospital Association, outpatient surgery is a surgical operation, whether major or minor, performed on patients who do not remain in the hospital overnight. Outpatient surgery may be performed in inpatient operating suites, outpatient surgery suites, or procedure rooms within an outpatient care facility. A surgical operation involving more than one surgical procedure is considered one surgical operation. See related Procedure .
Outpatient visit
The American Hospital Association defines outpatient visits as visits for receipt of medical, dental, or other services at a hospital by patients who are not lodged in the hospital. Each appearance by an outpatient to each unit of the hospital is counted individually as an outpatient visit, including all clinic visits, referred visits, observation services, outpatient surgeries, and emergency department visits. In the National Hospital Ambulatory Medical Care Survey an outpatient department visit is a direct personal exchange between a patient and a physician or other health care provider working under the physician's supervision for the purpose of seeking care and receiving personal health services. See related Emergency department or emergency room visit ; Outpatient department .
Overweight
See Body mass index (BMI) .
P
Pap smear
A Pap smear (also known as a Papanicolaou smear or Pap test) is a microscopic examination of cells scraped from the cervix that is used to detect cancerous or precancerous conditions of the cervix or other medical conditions. In the National Health Interview Survey questions concerning use of Pap smear were asked on an intermittent schedule, and the question content differed slightly across years. In 1987, women were asked to report when they had their most recent Pap smear in days, weeks, months, or years. Women who did not respond were asked a followup question, "Was it 3 years ago or less, between 3 and 5 years, or 5 years or more ago?" Pap smear data in the past 3 years were not available in 1990 and 1991. In 1993 and 1994, women were asked whether they had a Pap smear within the past year, between 1 and 3 years ago, or more than 3 years ago. In 1998 women were asked whether they had a Pap smear 1 year ago or less, more than 1 year but not more than 2 years, more than 2 years but not more than 3 years, more than 3 years but not more than 5 years, or more than 5 years ago. In 1999, women were asked when they had their most recent Pap smear in days, weeks, months, or years. In 1999, 4 percent of women in the sample responded "3 years ago." In this analysis, these women were coded as "within the past 3 years," although a response of "3 years ago" may include women whose last Pap smear was more than 3 but less than 4 years ago. Thus, estimates for 1999 are overestimated to some degree in comparison with estimates for previous years. In 2000 and 2003, women were asked when they had their most recent Pap smear (give month and year). Women who did not respond were given a followup question that used the 1999 wording and women who did not answer the followup question were asked a second followup question that used the 1998 wording. In 2000 and 2003 less than 1 percent of women in the sample answered "3 years ago" using the 1999 wording, and they were coded as "within the past 3 years." Thus, estimates for 2000 and 2003 may be slightly overestimated in comparison with estimates for years prior to 1999.
Partial care organization
Partial care treatment
Patient
See Home health care ; Hospice care ; Inpatient ; Office visit ; Outpatient visit .
Percent change
Perinatal mortality rate; ratio
Personal care homes with or without nursing
See Nursing home.
Personal health care expenditures
Physical activity, leisure-time
Beginning in 1998 leisure-time physical activity is assessed in the National Health Interview Survey by asking adults a series of questions about how often they do vigorous or light/moderate physical activity of at least 10 minutes duration and for about how long these sessions generally last. Vigorous physical activity is described as causing heavy sweating or a large increase in breathing or heart rate and light/moderate as causing light sweating or a slight to moderate increase in breathing or heart rate. Adults classified as inactive did not report any sessions of moderate or vigorous leisure-time physical activity of at least 10 minutes duration or reported they were unable to perform leisure-time physical activity. Adults classified with some leisure-time activity reported at least one session of light/moderate or vigorous activity but did not meet the requirement for regular leisure-time activity. Adults classified with regular leisure-time activity reported at least three sessions per week of vigorous leisure-time physical activity lasting at least 20 minutes in duration or at least five sessions per week of light or moderate physical activity lasting at least 30 minutes in duration.
Physician
Data on physician characteristics are obtained through physician self-report for the American Medical Association's (AMA) Physician Masterfile. The AMA tabulates data only for doctors of medicine (MDs), but some tables in Health, United States include data for both MDs and doctors of osteopathy (DOs).
- Active (or professionally active) physicians—These physicians are currently engaged in patient care or other professional activity for a minimum of 20 hours per week. Other professional activity includes administration, medical teaching, research, and other activities, such as employment with insurance carriers, pharmaceutical companies, corporations, voluntary organizations, medical societies, and the like. Physicians who are retired, semiretired, working part-time, or not practicing are classified as inactive and are excluded. Also excluded are physicians with address unknown and physicians who did not provide information on type of practice or present employment (not classified).
- Hospital-based physicians—These physicians are employed under contract with hospitals to provide direct patient care and include physicians in residency training (including clinical fellows) and full-time members of the hospital staff.
- Office-based physicians—These physicians are engaged in seeing patients in solo practice, group practice, two-physician practice, other patient care employment, or inpatient services such as those provided by pathologists and radiologists.
Data for physicians are presented by type of education (doctors of medicine and doctors of osteopathy); place of education (U.S. medical graduates and international medical graduates); activity status (professionally active and inactive); area of specialty; and geographic area. See related Office ; Physician specialty .
Physician specialty
A physician specialty is any specific branch of medicine in which a physician may concentrate. Data are based on physician self-reports of their primary area of specialty. Physician data are broadly categorized into two areas of practice: those who provide primary care, and those who provide specialty care.
- Primary care generalists—These physicians are physicians who practice in the general fields of family medicine, general practice, internal medicine, obstetrics and gynecology, and pediatrics. They specifically exclude primary care specialists associated with these generalist fields.
- Primary care specialists—These specialists practice in the primary care subspecialties of family medicine, internal medicine, obstetrics and gynecology, and pediatrics. Family medicine subspecialties include geriatric medicine and sports medicine. Internal medicine subspecialties include adolescent medicine, critical care medicine, diabetes, endocrinology, diabetes and metabolism, hematology, hepatology, hematology/oncology, cardiac electrophysiology, infectious diseases, clinical and laboratory immunology, geriatric medicine, sports medicine, nephrology, nutrition, medical oncology, pulmonary critical care medicine, and rheumatology. Obstetrics and gynecology subspecialties include gynecological oncology, gynecology, maternal and fetal medicine, obstetrics, critical care medicine, and reproductive endocrinology. Pediatric subspecialties include adolescent medicine, pediatric critical care medicine, pediatrics/internal medicine, neonatal-perinatal medicine, pediatric allergy, pediatric cardiology, pediatric endocrinology, pediatric infectious disease, pediatric pulmonology, medical toxicology (pediatrics), pediatric emergency medicine, pediatric gastroenterology, pediatric hematology/oncology, clinical and laboratory immunology (pediatrics), pediatric nephrology, pediatric rheumatology, and sports medicine (pediatrics).
- Specialty care physicians—These physicians are sometimes called specialists, and include primary care subspecialists listed above in addition to all other physicians not included in the generalist definition. Specialty fields include allergy and immunology, aerospace medicine, anesthesiology, cardiovascular diseases, child and adolescent psychiatry, colon and rectal surgery, dermatology, diagnostic radiology, forensic pathology, gastroenterology, general surgery, medical genetics, neurology, nuclear medicine, neurological surgery, occupational medicine, ophthalmology, orthopedic surgery, otolaryngology, psychiatry, public health and general preventive medicine, physical medicine and rehabilitation, plastic surgery, anatomic and clinical pathology, pulmonary diseases, radiation oncology, thoracic surgery, urology, addiction medicine, critical care medicine, legal medicine, and clinical pharmacology.
See related Physician .
Point-of-service (POS) plan
This is a health plan that allows members to choose to receive services from a participating or non-participating network provider, usually with a financial disincentive for going outside the network. More of a product than an organization, POS plans can be offered by HMOs, PPOs, or self-insured employers. See related Health maintenance organization (HMO); Managed care; Preferred provider organization (PPO).
Population
The U.S. Census Bureau collects and publishes data on populations in the United States according to several different definitions. Various statistical systems then use the appropriate population for calculating rates. See also Appendix I , Population Census and Population Estimates.
- Total population—This is the population of the United States, including all members of the Armed Forces living in foreign countries, Puerto Rico, Guam, and the U.S. Virgin Islands. Other Americans abroad (e.g., civilian Federal employees and dependents of members of the Armed Forces or other Federal employees) are not included.
- Resident population—This population includes persons whose usual place of residence (i.e., the place where one usually lives and sleeps) is in one of the 50 States or the District of Columbia. It includes members of the Armed Forces stationed in the United States and their families. It excludes international military, naval, and diplomatic personnel and their families located in this country and residing in embassies or similar quarters. Also excluded are international workers and international students in this country and Americans living abroad. The resident population is the denominator for calculating birth and death rates and incidence of disease.
- Civilian population—The civilian populatin is the resident population excluding members of the Armed Forces. However, families of members of the Armed Forces are included. This population is the denominator in rates calculated for the National Hospital Discharge Survey, the National Home and Hospice Care Survey, and the National Nursing Home Survey.
- Civilian noninstitutionalized population—This is the civilian population not residing in institutions such as correctional institutions, detention homes, and training schools for juvenile delinquents; homes for aged and dependent persons (e.g., nursing homes and convalescent homes); homes for dependent and neglected children; homes and schools for mentally or physically handicapped persons; homes for unwed mothers; psychiatric, tuberculosis, and chronic disease hospitals; and residential treatment centers. Census Bureau estimates of the civilian noninstitutionalized population are used to calculate sample weights for the National Health Interview Survey, National Health and Nutrition Examination Survey, and National Survey of Family Growth, and as denominators in rates calculated for the National Ambulatory Medical Care Survey and the National Hospital Ambulatory Medical Care Survey.
- Introduction of census 2000 population estimates—Health United States, 2003 marked the transition to the use of year 2000 resident population estimates based on the 2000 census for calculation of rates. Previously, 1991–2000 rates were based on post-1990 population estimates. Birth rates and death rates for 1991–99 were revised using intercensal population estimates based on the 2000 census. Rates for 2000 were revised using Census 2000 counts. Data systems and surveys that use civilian and civilian noninstitutionalized population estimates as denominators for computation of rates for the period 1991–99 have not been updated with intercensal estimates based on the 2000 civilian and civilian noninstitutionalized populations. See Appendix I , Population Census and Population Estimates.
Postneonatal mortality rate
Poverty level
Poverty statistics are based on definitions originally developed by the Social Security Administration. These include a set of money income thresholds that vary by family size and composition. Families or individuals with income below their appropriate thresholds are classified as below the poverty level. These thresholds are updated annually by the U.S. Census Bureau to reflect changes in the Consumer Price Index for all urban consumers (CPI-U). For example, the average poverty threshold for a family of four was $17,603 in 2000 and $13,359 in 1990. For more information, see Consumer Income and Poverty 2003. Series P-60. Washington, DC. U.S. Government Printing Office. 2003. Also see www.census.gov/hhes/www/poverty.html.
- National Health Interview Survey (NHIS) and National Health and Nutrition Examination Survey (NHANES)—Poverty level, for years prior to 1997, was based on family income and family size using Census Bureau poverty thresholds. In the NHIS, beginning in 1997 poverty status is based on family income, family size, number of children in the family, and for families with two or fewer adults, the age of the adults in the family. Poverty status in the NHANES is also based on family income and family size and composition. See related Consumer Price Index (CPI) ; Family income ; Appendix I , Current Population Survey; National Health Interview Survey; National Health and Nutrition Examination Survey.
Preferred provider organization (PPO)
A PPO is a type of medical plan where coverage is provided to participants through a network of selected health care providers (such as hospitals and physicians). The enrollees may go outside the network, but they would pay a greater percentage of the cost of coverage than within the network. See related Health maintenance organization (HMO) ; Managed care ; Point-of-service (POS) plan .
Prenatal care
Prenatal care is medical care provided to a pregnant woman to prevent complications and decrease the incidence of maternal and prenatal mortality. Information on when pregnancy care began is recorded on the birth certificate. Between 1970 and 1980, the reporting area for prenatal care expanded. In 1970, 39 States and the District of Columbia reported prenatal care on the birth certificate. Data were not available from Alabama, Alaska, Arkansas, Connecticut, Delaware, Georgia, Idaho, Massachusetts, New Mexico, Pennsylvania, and Virginia. In 1975 these data were available from three additional States—Connecticut, Delaware, and Georgia increasing the number of States reporting prenatal care to 42 and the District of Columbia. During 1980–2002 prenatal care information was available for the entire United States. In 2003, data on prenatal care was included for all States except Pennsylvania, and Washington both of which implemented the 2003 revision of the U.S. Standard Certificate of Live Birth. The prenatal care item on the 2003 certificate, "Date of first prenatal visit," is not comparable with the prenatal care item on the 1989 revision, "Month prenatal care began." In addition the 2003 revision recommends that information on prenatal care be gathered from prenatal care or medical records whereas the 1989 revision did not recommend a source for these data.
Prevalence
Prevalence is the number of cases of a disease, infected persons, or persons with some other attribute present during a particular interval of time. It is often expressed as a rate (e.g., the prevalence of diabetes per 1,000 persons during a year). See related Incidence .
Primary admission diagnosis
In the National Home and Hospice Care Survey the primary admission diagnosis is the first-listed diagnosis at admission on the patient's medical record as provided by the agency staff member most familiar with the care provided to the patient.
Primary care specialties
See Physician specialty .
Private expenditures
Procedure
The National Hospital Discharge Survey (NHDS) used to classify a procedure as a surgical or nonsurgical operation, diagnostic procedure, or therapeutic procedure (such as respiratory therapy); however the distinction between types of procedures has become less meaningful because of the development of minimally invasive and noninvasive surgery. Thus the practice of classifying the type of procedure has been discontinued. Procedures are coded according to the International Classification of Diseases, Ninth Revision, Clinical Modification (see table X). Up to four different procedures are coded in the NHDS. Procedures per hospital stay can be classified as any-listed—that is, if more than one procedure with the same code is performed it is counted only once— or all-listed where multiple occurrences of the same procedure would be counted the number of times it appears on the medical record up to the maximum of four available codes. For example, a triple coronary artery bypass graft would be counted once as "any-listed" but three times as "all-listed". All-listed procedures double-count the number of procedures of a given type that are performed, thus all listed procedure counts are greater than the number of hospital stays that occurred. Any-listed procedure counts approximate the number of hospital stays where a procedure was performed at any time during the stay. See related Outpatient surgery .
Proprietary hospitals
See Hospital .
Psychiatric hospitals
See Hospital ; Mental health organization.
Public expenditures
Public health activities
Public health activities may include any of the following essential services of public health—surveillance, investigations, education, community mobilization, workforce training, research, and personal care services delivered or funded by governmental agencies.
R
Race
In 1977, the Office of Management and Budget (OMB) issued Race and Ethnicity Standards for Federal Statistics and Administrative Reporting to promote comparability of data among Federal data systems. The 1977 Standards called for the Federal Government's data systems to classify individuals into the following four racial groups: American Indian or Alaska Native, Asian or Pacific Islander, black, and white. Depending on the data source, the classification by race was based on self-classification or on observation by an interviewer or other person filling out the questionnaire.
In 1997, new standards were announced for classification of individuals by race within the Federal Government's data systems (Federal Register, 62FR58781–58790). The 1997 Standards have five racial groups: American Indian or Alaska Native, Asian, Black or African American, Native Hawaiian or Other Pacific Islander, and White. These five categories are the minimum set for data on race in Federal statistics. The 1997 Standards also offer an opportunity for respondents to select more than one of the five groups, leading to many possible multiple-race categories. As with the single-race groups, data for the multiple-race groups are to be reported when estimates meet agency requirements for reliability and confidentiality. The 1997 Standards allow for observer or proxy identification of race but clearly state a preference for self-classification. The Federal Government considers race and Hispanic origin to be two separate and distinct concepts. Thus Hispanics may be of any race. Federal data systems were required to comply with the 1997 Standards by 2003.
- National Health Interview Survey (NHIS)—Starting with Health, United States, 2002, race-specific estimates based on the NHIS were tabulated using the 1997 Standards for data year 1999 and beyond and are not strictly comparable with estimates for earlier years. The 1997 Standards specify five single-race categories plus multiple-race categories. Estimates for specific race groups are shown when they meet requirements for statistical reliability and confidentiality. The race categories "White only," "Black or African American only," "American Indian and Alaska Native only," "Asian only," and "Native Hawaiian and Other Pacific Islander only" include persons who reported only one racial group; the category "2 or more races" includes persons who reported more than one of the five racial groups in the 1997 Standards or one of the five racial groups and "Some other race." Prior to data year 1999, data were tabulated according to the 1977 Standards with four racial groups, and the category "Asian only" included Native Hawaiian and Other Pacific Islander. Estimates for single-race categories prior to 1999 included persons who reported one race or, if they reported more than one race, identified one race as best representing their race. Differences between estimates tabulated using the two Standards for data year 1999 are discussed in the footnotes for each NHIS table in the Health, United States, 2002, 2003, and 2004 editions.Tables XII and XIII illustrate NHIS data tabulated by race and Hispanic origin according to the 1997 and 1977 Standards for two health statistics (cigarette smoking and private health insurance coverage). In these illustrations, three separate tabulations using the 1997 Standards are shown: 1) Race: mutually exclusive race groups, including several multiple-race combinations; 2) Race, any mention: race groups that are not mutually exclusive because each race category includes all persons who mention that race; and 3) Hispanic origin and race: detailed race and Hispanic origin with a multiple-race total category. Where applicable, comparison tabulations by race and Hispanic origin are shown based on the 1977 Standards. Because there are more race groups with the 1997 Standards, the sample size of each race group under the 1997 Standards is slightly smaller than the sample size under the 1977 Standards. Only those few multiple-race groups with sufficient numbers of observations to meet standards of statistical reliability are shown. Tables XII and XIII also illustrate changes in labels and group categories in the 1997 Standards. The race designation of Black was changed to Black or African American, and the ethnicity designation of Hispanic was changed to Hispanic or Latino.Data systems included in Health, United States, other than the NHIS, the National Survey of Drug Use & Health (NSDUH), and the National Health and Nutrition Examination Survey (NHANES), generally do not permit tabulation of estimates for the detailed race and ethnicity categories shown in tables XII and XIII, either because race data based on the 1997 standard categories are not yet available or because there are insufficient numbers of observations to meet statistical reliability or confidentiality requirements.
- National Health and Nutrition Examination Survey (NHANES)—Starting with Health, United States, 2003 race-specific estimates based on NHANES were tabulated using the 1997 Standards for data years 1999 and beyond. Prior to data year 1999, the 1977 Standards were used. Because of the differences between the two Standards, the race-specific estimates shown in trend tables based on the NHANES for 1999–2002 are not strictly comparable with estimates for earlier years. Each trend table based on the NHANES includes a footnote that discusses differences between estimates tabulated using the two Standards for survey years 1999–2002. Race in NHANES I and II was determined primarily by interviewer observation; starting with NHANES III, race was self-reported by survey participants.The NHANES sample was designed to provide estimates specifically for persons of Mexican origin and not for all Hispanic-origin persons in the United States. Persons of Hispanic origin other than Mexicans were entered into the sample with different selection probabilities that are not nationally representative of the total U.S. Hispanic population. Estimates are shown for non-Hispanic white, non-Hispanic black, and Mexican. Although data were collected according to the 1997 Standards, there are insufficient numbers of observations to meet statistical reliability or confidentiality requirements for reporting estimates for additional race categories.
- National Survey on Drug Use & Health (NSDUH)—Race-specific estimates based on NSDUH are tabulated using the 1997 Standards. Estimates in the NSDUH trend table begin with the data year 1999. Estimates for specific race groups are shown when they meet requirements for statistical reliability and confidentiality. The race categories "White only," "Black or African American only," "American Indian and Alaska Native only," "Asian only," and "Native Hawaiian and Other Pacific Islander only" include persons who reported only one racial group; and the category "2 or more races" includes persons who reported more than one of the five racial groups in the 1997 Standards or one of the five racial groups and "Some other race."
- National Vital Statistics System—Most of the States in the Vital Statistics Cooperative Program are still revising their birth and death records to conform to the 1997 standards on race and ethnicity. During the transition to full implementation of the 1997 standards, vital statistics data will continue to be presented for the four major race groups—white, black or African American, American Indian or Alaska Native, and Asian or Pacific Islander—in accordance with 1977 standards.
- Birth File—Information about the race and Hispanic ethnicity of the mother and father are provided by the mother at the time of birth and recorded on the birth certificate and fetal death record. Since 1980, birth rates, birth characteristics, and fetal death rates for live-born infants and fetal deaths are presented in this report according to race of mother. Before 1980 data were tabulated by race of newborn and fetus, taking into account the race of both parents. If the parents were of different races and one parent was white, the child was classified according to the race of the other parent. When neither parent was white, the child was classified according to father's race, with one exception: if either parent was Hawaiian, the child was classified Hawaiian. Before 1964, if race was unknown, the birth was classified as white. Beginning in 1964 unknown race was classified according to information on the birth record. Beginning with the 2000 data year, the race and ethnicity data used for denominators (population) to calculate birth rates are collected in accordance with 1997 revised OMB standards for race and ethnicity. However, the numerators (births) will not be compatible with the denominators until all the States revise their birth certificates to reflect the new standards. In order to compute rates, it is necessary to bridge population data for multiple-race persons to single-race categories. See Appendix I , Population Census and Population Estimates, Bridged-Race Population Estimates for Census 2000.Beginning with the 2003 data year, multiple-race data were reported by both Pennsylvania and Washington, which used the 2003 revision of the U.S. Standard Certificate of Live Birth, as well as California, Hawaii, Ohio (for births occurring in December only), and Utah, which used the 1989 revision of the U.S. Standard Certificate of Live Birth. These six States, which accounted for 20.7 percent of births in the United States in 2003, reported 2.6 percent of mothers as multiracial, with levels varying from 0.7 percent (Ohio) to 37.5 percent (Hawaii). Data from the vital records of the remaining 44 States and the District of Columbia followed the 1977 OMB standards in which a single race is reported. In order to provide uniformity and comparability of the data during the transition period, before multiple-race data are available for all reporting areas, it is necessary to "bridge" the responses of those who reported more than one race to a single race. See Martin JA, Hamilton BE, et al. Births: Final Data for 2003. National vital statistics reports; forthcoming. Hyattsville, MD: National Center for Health Statistics. 2005.Although the bridging procedure imputes multiple-race of mothers to one of the four minimum races stipulated in the 1977 race and ethnicity standards, mothers of a specified Asian or Pacific Islander (API) subgroup (Chinese, Japanese, Hawaiian, or Filipino) in combination with another race (American Indian or Alaska Native, Black, or White) or another API subgroup cannot be imputed to a single Asian or Pacific Islander subgroup. In 2003, API mothers were disproportionately represented in the six States reporting multiple-race (44 percent). Data are not shown for the API subgroups or reported alone or in combination with other races or other API subgroups because the bridging technique cannot be applied in this detail. These data are available in the 2003 Natality public-use data file, which can be found at http://www.cdc.gov/nchs/births.htm.
- Mortality File—Information about the race and Hispanic ethnicity of the decedent is reported by the funeral director as provided by an informant, often the surviving next of kin, or, in the absence of an informant, on the basis of observation. Death rates by race and Hispanic origin are based on information from death certificates (numerators of the rates) and on population estimates from the Census Bureau (denominators). Race and ethnicity information from the census is by self-report. To the extent that race and Hispanic origin are inconsistent between these two data sources, death rates will be biased. Studies have shown that persons self-reported as American Indian, Asian, or Hispanic on census and survey records may sometimes be reported as white or non-Hispanic on the death certificate, resulting in an underestimation of deaths and death rates for the American Indian, Asian, and Hispanic groups. Bias also results from undercounts of some population groups in the census, particularly young black males, young white males, and elderly persons, resulting in an overestimation of death rates. The net effects of misclassification and undercoverage result in overstated death rates for the white population and black population are estimated to be 1 percent and 5 percent, respectively; understated death rates for other population groups are estimated as follows: American Indians, 21 percent; Asian or Pacific Islanders, 11 percent; and Hispanics, 2 percent. For more information, see Rosenberg HM, Maurer JD, Sorlie PD, et al. Quality of death rates by race and Hispanic origin: A summary of current research, 1999. National Center for Health Statistics. Vital Health Stat 2(128). 1999.Denominators for infant and maternal mortality rates are based on number of live births rather than population estimates. Race information for the denominator is supplied from the birth certificate. Before 1980, race of child for the denominator took into account the races of both parents. Starting in 1980 race information for the denominator was based solely on race of mother. Race information for the numerator is supplied from the death certificate. For the infant mortality rate, race information for the numerator is race of the deceased child; for the maternal mortality rate, it is race of the mother.Vital event rates for the American Indian or Alaska Native population shown in this book are based on the total U.S. resident population of American Indians and Alaska Natives, as enumerated by the U.S. Census Bureau. In contrast the Indian Health Service calculates vital event rates for this population based on U.S. Census Bureau county data for American Indians and Alaska Natives who reside on or near reservations. Interpretation of trends for the American Indian and Alaska Native population should take into account that population estimates for these groups increased by 45 percent between 1980 and 1990, partly because of better enumeration techniques in the 1990 decennial census and the increased tendency for people to identify themselves as American Indian in 1990.Interpretation of trends for the Asian population in the United States should take into account that this population more than doubled between 1980 and 1990, primarily because of immigration. Between 1990 and 2000, the increase in the Asian population was 48 percent for persons reporting that they were Asian alone, and 72 percent for persons who reported they were either Asian alone or in combination with another race.For more information on coding race using vital statistics, see National Center for Health Statistics, Technical Appendix. Vital Statistics of the United States, Vol. I, Natality, and Vol. II, Mortality, Part A available on the NCHS home page at www.cdc.gov/nchs/nvss.htm. See related Hispanic origin ; Appendix I , Population Census and Population Estimates.
Rate
A rate is a measure of some event, disease, or condition in relation to a unit of population, along with some specification of time. See related Age adjustment ; Population .
- Birth and related ratesBirth rate is calculated by dividing the number of live births in a population in a year by the midyear resident population. For census years, rates are based on unrounded census counts of the resident population, as of April 1. For the noncensus years 1981–89, rates were based on national estimates of the resident population, as of July 1, rounded to 1,000s. Rounded population estimates for 5-year age groups were calculated by summing unrounded population estimates before rounding to 1,000s. Starting in 1991 rates were based on unrounded national population estimates. Beginning in 1997, the birth rate for the maternal age group 45–49 years includes data for mothers age 50–54 years in the numerator and is based on the population of women age 45–49 years in the denominator. Birth rates are expressed as the number of live births per 1,000 population. The rate may be restricted to births to women of specific age, race, marital status, or geographic location (specific rate), or it may be related to the entire population (crude rate). See related Cohort fertility .Fertility rate is the total number of live births, regardless of age of mother, per 1,000 women of reproductive age, 15–44 years.
- Death and related ratesDeath rate is calculated by dividing the number of deaths in a population in a year by the midyear resident population. For census years, rates are based on unrounded census counts of the resident population, as of April 1. For the noncensus years 1981–89, rates were based on national estimates of the resident population, as of July 1, rounded to 1,000s. Rounded population estimates for 10-year age groups were calculated by summing unrounded population estimates before rounding to 1,000s. Starting in 1991, rates were based on unrounded national population estimates. Rates for the Hispanic and non-Hispanic white populations in each year are based on unrounded State population estimates for States in the Hispanic reporting area. Death rates are expressed as the number of deaths per 100,000 population. The rate may be restricted to deaths in specific age, race, sex, or geographic groups or from specific causes of death (specific rate), or it may be related to the entire population (crude rate).Fetal death rate is the number of fetal deaths with stated or presumed gestation of 20 weeks or more divided by the sum of live births plus fetal deaths, per 1,000 live births plus fetal deaths. Late fetal death rate is the number of fetal deaths with stated or presumed gestation of 28 weeks or more divided by the sum of live births plus late fetal deaths, per 1,000 live births plus late fetal deaths. See related Gestation .Infant mortality rate based on period files is calculated by dividing the number of infant deaths during a calendar year by the number of live births reported in the same year. It is expressed as the number of infant deaths per 1,000 live births. Neonatal mortality rate is the number of deaths of children under 28 days of age, per 1,000 live births. Postneonatal mortality rate is the number of deaths of children that occur between 28 days and 365 days after birth, per 1,000 live births. See related Infant death.Birth cohort infant mortality rates are based on linked birth and infant death files. In contrast to period rates in which the births and infant deaths occur in the same period or calendar year, infant deaths constituting the numerator of a birth cohort rate may have occurred in the same year as, or in the year following, the year of birth. The birth cohort infant mortality rate is expressed as the number of infant deaths per 1,000 live births. See related Birth cohort.Perinatal relates to the period surrounding the birth event. Rates and ratios are based on events reported in a calendar year. Perinatal mortality rate is the sum of late fetal deaths plus infant deaths within 7 days of birth divided by the sum of live births plus late fetal deaths, per 1,000 live births plus late fetal deaths.Perinatal mortality ratio is the sum of late fetal deaths plus infant deaths within 7 days of birth divided by the number of live births, per 1,000 live births.Maternal mortality rate is defined as the number of maternal deaths per 100,000 live births. The maternal mortality rate is a measure of the likelihood that a pregnant woman will die from maternal causes. The number of live births used in the denominator is a proxy for the population of pregnant women who are at risk of a maternal death. See related Maternal death.Visit rate is a basic measure of service utilization for event-based data. Examples of events include physician office visits with drugs provided or hospital discharges. In the visit rate calculation, the numerator is the number of estimated events, and the denominator is the corresponding U.S. population estimate for those who possibly could have had events during a given period of time. The interpretation is that for every person in the population there were, on average, x events. It does not mean that x percent of the population had events, because some persons in the population had no events while others had multiple events. The only exception is when an event can occur just once for a person (e.g., if an appendectomy were performed during a hospital stay). The visit rate is best used to compare utilization across various subgroups of interest such as age or race groups or geographic regions (e.g., the rate of hospital discharges in 2002 was 43.4 per 1,000 population for children under 18 years of age and 466.6 per 1, 000 population for adults 75 years and over).
Region
Registered hospitals
See Hospital .
Registered nursing education
Registered nursing data are shown by level of educational preparation. Baccalaureate education requires at least 4 years of college or university; associate degree programs are based in community colleges and are usually 2 years in length; and diploma programs are based in hospitals and are usually 3 years in length.
Registration area
The United States has separate registration areas for birth, death, marriage, and divorce statistics. In general, registration areas correspond to States and include two separate registration areas for the District of Columbia and New York City. All States have adopted laws that require registration of births and deaths and reporting of fetal deaths. It is believed that more than 99 percent of births and deaths occurring in this country are registered.
The death registration area was established in 1900 with 10 States and the District of Columbia, and the birth registration area was established in 1915, also with 10 States and the District of Columbia. Beginning with 1933, all States were included in the birth and death registration areas. The specific States added year by year are shown in "History and Organization of the Vital Statistics System." Reprinted from Vital Statistics of the United States Vol. I, 1950, chapter 1. National Center for Health Statistics. 1978. Currently, Puerto Rico, U.S. Virgin Islands, and Guam each constitutes a separate registration area, although their data are not included in statistical tabulations of U.S. resident data. See related Reporting area .
Relative standard error
The relative standard error (RSE) is a measure of an estimate's reliability. The RSE of an estimate is obtained by dividing the standard error of the estimate (SE(r)) by the estimate itself (r). This quantity is expressed as a percentage of the estimate and is calculated as follows: RSE = 100 x (SE(r)/r). Estimates with large RSEs are considered unreliable. In Health, United States most statistics with large RSEs are preceded by an asterisk or are not presented.
Relative survival rate
The relative survival rate is the ratio of the observed survival rate for the patient group to the expected survival rate for persons in the general population similar to the patient group with respect to age, sex, race, and calendar year of observation. The 5-year relative survival rate is used to estimate the proportion of cancer patients potentially curable. Because over one-half of all cancers occur in persons 65 years of age and over, many of these individuals die of other causes with no evidence of recurrence of their cancer. Thus, because it is obtained by adjusting observed survival for the normal life expectancy of the general population of the same age, the relative survival rate is an estimate of the chance of surviving the effects of cancer.
Reporting area
In the National Vital Statistics System, the reporting area for such basic items on the birth and death certificates as age, race, and sex is based on data from residents of all 50 States in the United States and the District of Columbia (DC). The reporting area for selected items such as Hispanic origin, educational attainment, and marital status is based on data from those States that require the item to be reported, whose data meet a minimum level of completeness (such as 80 or 90 percent), and are considered to be sufficiently comparable to be used for analysis. In 1993–96 the reporting area for Hispanic origin of decedent on the death certificate included 49 States and DC. Starting in 1997 the Hispanic reporting area includes all 50 States and DC. See related Registration area ; Appendix I , National Vital Statistics System.
Resident
In the Online Survey Certification and Reporting database, all residents in certified facilities are counted on the day of certification inspection. In the National Nursing Home Survey, a resident is a person on the roster of the nursing home as of the night before the survey. Included are all residents for whom beds are maintained even though they may be on overnight leave or in a hospital. See related Nursing home .
Resident population
See Population.
Residential treatment care
Residential treatment centers for emotionally disturbed children
Rural
See Urbanization .
S
Self-assessment of health
Serious psychological distress
The serious psychological distress scale (K6) is a six-item scale developed to measure serious mental illness. The K6 was asked of adults 18 years of age and older. The answers were self-reported and no proxies were allowed. The K6 is designed to identify persons with serious psychological distress using as few questions as possible. The six items included in the K6 are as follows: During the past 30 days, how often did you feel . . .
- so sad that nothing could cheer you up?
- nervous?
- restless or fidgety?
- hopeless?
- that everything was an effort?
- worthless?
Possible answers are all of the time (4 points), most of the time (3 points), some of the time (2 points), a little of the time (1 point), and none of the time (0 points).
To score the K6, the points are added together yielding a possible total of 0 to 24 points. A threshold of 13 or more is used to define serious mental illness. Persons answering "some of the time" to all six questions would not reach the threshold for serious mental illness, because to achieve a score of 13 they would need to answer "most of the time" to at least one item.
For more information, see Kessler RC, Barker PR, Colpe LJ, et al. Screening for serious mental illness in the general population. Arch Gen Psychiatry 60:184–189, 2003.
Short-stay hospital
See Hospital .
Skilled nursing facility
See Nursing home .
Smoker
See Cigarette smoking .
Specialty hospital
See Hospital .
State health agency
A State health agency is the agency or department within State government headed by the State or territorial health official. Generally, the State health agency is responsible for setting statewide public health priorities, carrying out national and State mandates, responding to public health hazards, and assuring access to health care for underserved State residents.
State Children's Health Insurance Program (SCHIP)
Title XXI of the Social Security Act, known as the State Children's Health Insurance Program (SCHIP), is a program initiated by the Balanced Budget Act of 1997 (BBA). SCHIP provides more Federal funds for States to provide health care coverage to low-income, uninsured children. SCHIP gives States broad flexibility in program design while protecting beneficiaries through Federal standards. Funds from SCHIP may be used to expand Medicaid or to provide medical assistance to children during a presumptive eligibility period for Medicaid. This is one of several options from which States may select to provide health care coverage for more children, as prescribed within the BBA's Title XXI program. See related Health insurance coverage; Medicaid.
Substance use
This term refers to the use of selected substances including alcohol, tobacco products, drugs, inhalants, and other substances that can be consumed, inhaled, injected, or otherwise absorbed into the body with possible detrimental effects.
The Monitoring the Future Study (MTF)
The MTF collects information on use of selected substances using self-completed questionnaires to a school-based survey of secondary school students. MTF has tracked 12th-graders' illicit drug use and attitudes towards drugs since 1975. In 1991, 8th and 10th graders were added to the study. The survey includes questions on abuse of substances including (but not limited to) marijuana, inhalants, illegal drugs, alcohol, cigarettes, and other tobacco products. A standard set of three questions is used to assess use of the substances in the past month. "Past month" refers to an individual's use of a substance at least once during the month preceding their response to the survey. See related Appendix I, Monitoring the Future Study.
National Survey on Drug Use & Health (NSDUH)
The NSDUH conducts in-person interviews of a sample of individuals 12 years of age and older at their place of residence. For illicit drug use, alcohol use, and tobacco use, information is collected about use in past month. For information on illicit drug use, respondents in the NSDUH are asked about use of marijuana/hashish, cocaine (including crack), inhalants, hallucinogens, heroin, and prescription-type drugs used nonmedically (pain relievers, tranquilizers, stimulants, and sedatives). A series of questions is asked about each substance: "Have you ever, even once, used [e.g., Ecstasy, also know as MDMA/substance]?" "Think specifically about the past 30 days, from [date] up to and including today. During the past 30 days, on how many days did you use [substance]?" Numerous probes and checks are included in the computer-assisted interview system. Nonprescription medications and legitimate uses under a doctor's supervision are not included in the survey. Summary measures such as "any illicit drug use" are produced. See related Alcohol consumption ; Cigarette smoking ; Illicit drug use ; Appendix I , National Survey on Drug Use & Health.
Suicidal ideation
Suicidal ideation is having thoughts of suicide or of taking action to end one's own life. Suicidal ideation includes all thoughts of suicide, both when the thoughts include a plan to commit suicide and when they do not include a plan. Suicidal ideation is measured in the Youth Risk Behavior Survey by the question "During the past 12 months, did you ever seriously consider attempting suicide?"
Surgical operation
See Procedure .
Surgical specialty
See Physician specialty .
T
Tobacco use
See Cigarette smoking .
U
Uninsured
In the Current Population Survey (CPS), persons are considered uninsured if they do not have coverage through private health insurance, Medicare, Medicaid, State Children's Health Insurance Program, military or Veterans coverage, another government program, a plan of someone outside the household, or other insurance. In addition, if the respondent has missing Medicaid information but has income from certain low-income public programs, then Medicaid coverage is imputed. The questions on health insurance are administered in March and refer to the previous calendar year.
In the National Health Interview Survey (NHIS), the uninsured are persons who do not have coverage under private health insurance, Medicare, Medicaid, public assistance, a State-sponsored health plan, other government-sponsored programs, or a military health plan. Persons with only Indian Health Service coverage are considered uninsured. Estimates of the percentage of persons who are uninsured based on the NHIS (table 134) may differ slightly from those based on the March CPS (table 156) because of differences in survey questions, recall period, and other aspects of survey methodology. In 2003 in the NHIS, 1.1 percent of adults age 65 years and over had no health insurance, but the small sample size precludes the presentation of separate estimates for this population. Therefore the term "uninsured" refers only to the population under age 65. See related Health insurance coverage ; Appendix I , Current Population Survey.
Urbanization
Urbanization is the degree of urban (city-like) character or nature of a particular geographic area. In this report death rates are presented according to the urbanization level of the decedent's county of residence. Counties and county equivalents were assigned to one of five urbanization levels using Office of Management and Budget's (OMB) standards for metropolitan statistical areas (MSAs) and micropolitan statistical areas and the Rural-Urban Continuum code system to differentiate among metropolitan areas based on population.
There are three major categories of counties. OMB classifies counties as metropolitan or micropolitan. Counties not categorized by OMB are neither metropolitan nor micropolitan.
OMB's classification of metropolitan counties are further differentiated in Health, United States by population size using the Rural-Urban Continuum code system (August 2003 Revision) developed by the Economic Research Service, U.S. Department of Agriculture. Metropolitan counties are classified by the population size of their metropolitan area to one of three metropolitan urbanization levels:
- Large—counties in MSAs with 1 million or more population.
- Medium— counties MSAs with 250,000 to 1 million population.
- Small—counties in MSAs with less than 250,000 population.
See Metropolitan statistical area (MSA) for definitions of metropolitan and nonmetropolitan counties.
Nonmetropolitan counties are categorized using the OMB's classification of nonmetropolitan micropolitan statistical areas (February 2004 Revision). Nonmetropolitan counties are classified into two categories:
- Micropolitan—counties defined by OMB as micropolitan based on population criteria.
- Nonmicropolitan—nonmetropolitan counties that do not meet the population criteria for micropolitan.
See Micropolitan statistical area for definitions of micropolitan and nonmicropolitan counties.
Usual source of care
Usual source of care was measured in the National Health Interview Survey (NHIS) in 1993 and 1994 by asking the respondent "Is there a particular person or place that ____ usually goes to when ____ is sick or needs advice about ___ health?" In the 1995 and 1996 NHIS, the respondent was asked "Is there one doctor, person, or place that ____ usually goes to when ____ is sick or needs advice about health?" Starting in 1997 the respondent was asked "Is there a place that ____ usually goes when he/she is sick or you need advice about (his/her) health?" Persons who report the emergency department as their usual source of care are defined as having no usual source of care in this report.
W
Wages and salaries
Y
Years of potential life lost (YPLL)
YPLL is a measure of premature mortality. Starting with Health, United States, 1996–97, YPLL is presented for persons under 75 years of age because the average life expectancy in the United States is over 75 years. YPLL-75 is calculated using the following eight age groups: under 1 year, 1–14 years, 15–24 years, 25–34 years, 35–44 years, 45–54 years, 55–64 years, and 65–74 years. The number of deaths for each age group is multiplied by years of life lost, calculated as the difference between age 75 years and the midpoint of the age group. For the eight age groups, the midpoints are 0.5, 7.5, 19.5, 29.5, 39.5, 49.5, 59.5, and 69.5. For example, the death of a person 15–24 years of age counts as 55.5 years of life lost. Years of potential life lost is derived by summing years of life lost over all age groups. In Health, United States, 1995 and earlier editions, YPLL was presented for persons under 65 years of age. For more information, see Centers for Disease Control. MMWR 35(2S):suppl. 1986. Available at: www.cdc.gov/mmwr/preview/mmwrhtml/00001773.htm.
- Acquired immunodeficiency syndrome (AIDS)
- Active physician
- Activities of daily living (ADL)
- Addition
- Admission
- Age
- Age adjustment
- AIDS
- Alcohol consumption
- Any-listed diagnosis
- Average annual rate of change (percent change)
- Average length of stay
- Bed
- Birth cohort
- Birth rate
- Birthweight
- Body mass index (BMI)
- Cause of death
- Cause-of-death ranking
- Chronic condition
- Cigarette smoking
- Civilian noninstitutionalized population; Civilian population
- Cohort fertility
- Community hospitals
- Comparability ratio
- Compensation
- Condition
- Consumer Price Index (CPI)
- Contraception
- Crude birth rate; Crude death rate
- Days of care
- Death rate
- Dental caries
- Dental visit
- Diagnosis
- Diagnostic and other nonsurgical procedures
- Discharge
- Domiciliary care homes
- Drug abuse
- Drug class, major
- Drugs
- Education
- Emergency department
- Emergency department or emergency room visit
- Employer costs for employee compensation
- Ethnicity
- Exercise
- Expenditures
- External cause of injury
- Family income
- Federal hospitals
- Fee-for-service health insurance
- Fertility rate
- General hospitals
- General hospitals providing separate psychiatric services
- Geographic region and division
- Gestation
- Gross domestic product (GDP)
- Health care contact
- Health expenditures, national
- Health insurance coverage
- Health maintenance organization (HMO)
- Health services and supplies expenditures
- Health status, respondent-assessed
- Hispanic origin
- HIV
- Home health care
- Home visit
- Hospice care
- Hospital
- Hospital-based physician
- Hospital days
- Hospital utilization
- Human immunodeficiency virus (HIV) disease
- ICD; ICD codes
- Illicit drug use
- Incidence
- Income
- Individual practice association (IPA)
- Industry of employment
- Infant death
- Injury
- Injury-related visit
- Inpatient
- Inpatient care
- Inpatient days
- Instrumental activities of daily living (IADL)
- Insured
- Intermediate care facilities
- International Classification of Diseases (ICD)
- International Classification of Diseases, Ninth Revision, Clinical Modification (ICD–9–CM)
- Late fetal death rate
- Leading causes of death
- Length of stay
- Life expectancy
- Limitation of activity
- Live-birth order
- Long-term care facility
- Low birthweight
- Mammography
- Managed care
- Marital status
- Maternal age
- Maternal death
- Maternal education
- Maternal mortality rate
- Medicaid
- Medical specialties
- Medical vendor payments
- Medicare
- Mental health organization
- Mental health service type
- Metropolitan statistical area (MSA)
- Micropolitan statistical area
- Multiservice mental health organizations
- National Drug Code (NDC) Directory therapeutic class
- Neonatal mortality rate
- Nonpatient revenues
- Nonprofit hospitals
- North American Industry Classification System (NAICS)
- Notifiable disease
- Nurse supply estimates
- Nursing care
- Nursing care homes
- Nursing home
- Nursing home expenditures
- Obesity
- Occupancy rate
- Office
- Office-based physician
- Office visit
- Operations
- Outpatient department
- Outpatient surgery
- Outpatient visit
- Overweight
- Pap smear
- Partial care organization
- Partial care treatment
- Patient
- Percent change
- Perinatal mortality rate; ratio
- Personal care homes with or without nursing
- Personal health care expenditures
- Physical activity, leisure-time
- Physician
- Physician specialty
- Point-of-service (POS) plan
- Population
- Postneonatal mortality rate
- Poverty level
- Preferred provider organization (PPO)
- Prenatal care
- Prevalence
- Primary admission diagnosis
- Primary care specialties
- Private expenditures
- Procedure
- Proprietary hospitals
- Psychiatric hospitals
- Public expenditures
- Public health activities
- Race
- Rate
- Region
- Registered hospitals
- Registered nursing education
- Registration area
- Relative standard error
- Relative survival rate
- Reporting area
- Resident
- Resident population
- Residential treatment care
- Residential treatment centers for emotionally disturbed children
- Rural
- Self-assessment of health
- Serious psychological distress
- Short-stay hospital
- Skilled nursing facility
- Smoker
- Specialty hospital
- State health agency
- State Children's Health Insurance Program (SCHIP)
- Substance use
- The Monitoring the Future Study (MTF)
- National Survey on Drug Use & Health (NSDUH)
- Suicidal ideation
- Surgical operation
- Surgical specialty
- Tobacco use
- Uninsured
- Urbanization
- Usual source of care
- Wages and salaries
- Years of potential life lost (YPLL)
- Appendix II - Definitions and Methods - Health, United States, 2005Appendix II - Definitions and Methods - Health, United States, 2005
Your browsing activity is empty.
Activity recording is turned off.
See more...