From: Section II, The Physical Map

NCBI Bookshelf. A service of the National Library of Medicine, National Institutes of Health.

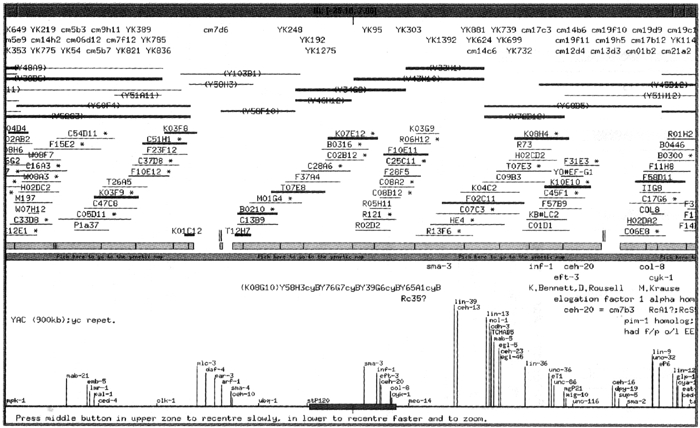
A detail of the physical map. This representation taken from an ACeDB screen shows, from the top of the figure, the positions of (1) cDNAs, determined by hybridization against YACs representing the genome (the “polytene”YAC grid); (2) YACs, determined by hybridization to selected cosmids; and (3) cosmids, whose overlap was established by fingerprint analysis. The discontinuous bar beneath the cosmids indicates the extent of available genomic sequence. The bar across the window provides rapid access within ACeDB to the same position on the genetic map. Below this bar are shown the positions of defined genes, along with various remarks relating to the assembly of the map. At the bottom is an overview of the region of chromosome III in which the above map lies. The extent covered is represented by the solid rectangle. The YAC and cosmid clones shown with heavy lines are those clones selected for either the YAC “polytene”grid or the cosmid grid. Cosmids marked with an asterisk indicate the presence of additional analyzed clones not shown on this view.
From: Section II, The Physical Map

NCBI Bookshelf. A service of the National Library of Medicine, National Institutes of Health.