
All copyright for chapters belongs to the individual authors who created them. However, for non-commercial, academic purposes, images and content from the chapters portion of Webvision may be used with a non-exclusive rights under a Attribution, Noncommercial 4.0 International (CC BY-NC) Creative Commons license. Cite Webvision, http://webvision.med.utah.edu/ as the source. Commercial applications need to obtain license permission from the administrator of Webvision and are generally declined unless the copyright owner can/wants to donate or license material. Use online should be accompanied by a link back to the original source of the material. All imagery or content associated with blog posts belong to the authors of said posts, except where otherwise noted.
NCBI Bookshelf. A service of the National Library of Medicine, National Institutes of Health.
Kolb H, Fernandez E, Nelson R, editors. Webvision: The Organization of the Retina and Visual System [Internet]. Salt Lake City (UT): University of Utah Health Sciences Center; 1995-.
Photoreceptors
Authors
Helga Kolb, PhD 1.
1.Affiliations
Corresponding author.Created: May 1, 2005; Last Update: February 28, 2012.
Two or three types of cone photoreceptor and a single type of rod photoreceptor are present in the normal mammalian retina. Some non-mammalian retinas have even more cone types (see later).
1. Light microscopy and ultrastructure of rods and cones
In vertical sections of retina prepared for light microscopy with the rods and cones nicely aligned, the rods and cones can be distinguished rather easily.
Cones are robust conical-shaped structures with cell bodies situated in a single row just below the outer limiting membrane (OLM) and with inner and outer segments protruding into the subretinal space towards the pigment epithelium (Fig. 1, Fig. 2). In foveal retina, where only cones are concentrated, their cell bodies are layered in oblique columns below the outer limiting membrane. Rods, on the other hand, are slim rod-shaped structures with their inner and outer segments filling the area between the larger cones in the subretinal space and stretching to the pigment epithelium cells. Rod cell bodies make up the remainder of the outer nuclear layer below the cone cell bodies. Apical processes from the pigment epithelium envelop the outer segments of both rods and cones (not always clear in histological sections).
The higher magnification afforded by the electron microscope allows better resolution of rod and cone photoreceptors.
Ultrathin sections viewed in an electron microscope (Fig. 2, Fig. 3) show rods and cones from human and squirrel retinas (1). The photoreceptor consists of 1) an outer segment, filled with stacks of membranes (like a stack of poker chips) containing the visual pigment molecules such as rhodopsins, 2) an inner segment containing mitochondria, ribosomes and membranes where opsin molecules are assembled and passed to be part of the outer segment discs, 3) a cell body containing the nucleus of the photoreceptor cell and 4) a synaptic terminal where neurotransmission to second order neurons occurs.
Outer and inner segments of rods (i.s.) are generally thinner than those of cones in mammalian retinas. For example, the rod inner segments are 2 μm and the cone inner segments are about 6 μm in diameter in peripheral human retina. In the fovea, however, where there are only cone photoreceptors, the most central cones are even thinner than the average rod at about 1.5 μm diameter. Inner segment regions of both rods and cones are filled with long thin mitochondria. At the top of the inner segment a thin cilium joins the inner and outer segments of the rods and cones (Fig. 3 and see movie 1).
2. Outer segment generation
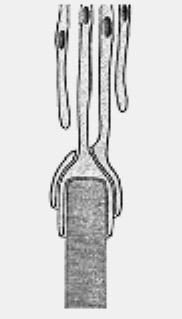
It is from the base of the cilium that membrane evaginations and invaginations occur to produce the outer segment (o.s.) or the important visual pigment-bearing portion of the photoreceptor. Outer segments of both the rods and cones arises from outpouching (Fig. 4) of the photoreceptor cell plasma membrane at this point (see below) (2). An animation of outer segment generation appears in movie 2.
These expanding membrane plates (Fig. 5) become detached as free floating discs inside the outer segment membrane in the case of the rods. In the case of the cones though, the outer segment discs remain attached to the outer segment membrane.
So the outer segment is a structure filled entirely with discs of folded double membranes in which are embedded the light sensitive visual pigment molecules (Fig. 6).
The opsin molecule, which binds the chromophore 11-cis retinal to form the visual pigment, is manufactured in the Golgi apparatus of the inner segment and presented to the outer membrane at the cilium, via fusion areas using G-proteins (3, 4).
In contrast, the other part of the visual pigment molecule in the outer segment discs which is retinal (vitamin A product), is provided to the discs from the pigment epithelium via carrier molecules (retinal binding proteins, IRBP) within the interphotoreceptor matrix of the subretinal space (Fig. 7) (5, 6). This is further covered in the chapter The Retinal Pigment Epithelium by Olaf Strauss.
3. Visual pigments and visual transduction
Vertebrate photoreceptors can respond to light by virtue of their containing a visual pigment embedded in the bilipid membranous discs that make up the outer segment. The visual pigment consists of a protein called opsin and a chromophore derived from vitamin A known as retinal. The vitamin A is manufactured from beta-carotene in the food we eat, and the protein is manufactured in the photoreceptor cell (see above). The opsin and the chromophore are bound together and lie buried in the membranes of the outer segment discs (Fig. 8).
About 50% of the opsin is within the bilipid membrane connected by short protein loops outside. Each molecule of rhodopsin consists of seven of these transmembrane portions surrounding the chromophore (11-cis retinal) in the lipid bilayer (Fig. 9). The chromophore apparently lies horizontally in the membrane and is bound at a lysine residue to helix seven (7, 8) (Fig. 9). Each outer segment disc, of course, contains many thousands of visual pigment molecules. Upon absorption of a photon of light, the retinal isomerizes from the 11-cis form to the all-trans form which starts conformational changes in the molecule resulting in bleaching. Several intermediaries are formed in bleaching among them metarhodopsin II which activates the G-protein transducin and a further cascade of events summarized below (7, 9) and in the Webvision chapter Phototransduction in Rods and Cones by Yingbin Fu.
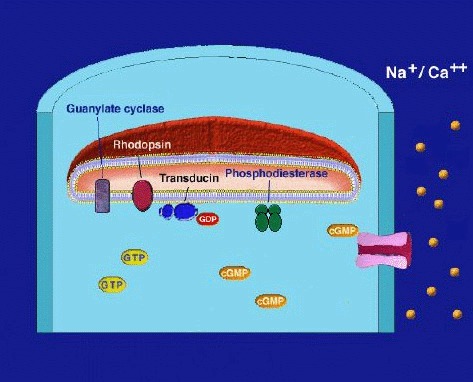
Light transduces the visual pigment via the following enzyme cascade: photons - rhodopsin - activated rhodopsin (metarhodopsin II) - a GTP binding protein (transducin) - an enzyme hydrolyzing cGMP (cGMP-phosphodiesterase) - closes a membrane bound cGMP-gated cation channel. The Webvision chapter on Phototransduction explains the details of this process.
In the dark, steady current flows into the open channels, carried mainly by Na+ ions, constituting a "dark current" that partially depolarizes the photoreceptor cell (Fig. 10). Thus, the depolarized photoreceptor releases neurotransmitter (the amino acid glutamate) from its synaptic terminals onto second-order neurons in the dark. On light stimulation the rhodopsin molecules are isomerized to the active form, the above cascade ensues, leading to closure of the cation channels of the photoreceptor membrane, stopping the dark current and causing the photoreceptor cell membrane to hyperpolarize and cease neurotransmitter release to second-order neurons (Fig. 10) (10-13).
The "dark current" is composed mainly of the influx of the Na+ component (80%) however, a Ca2+ component (15%) and a Mg2+ component (5%) are also present (13). In darkness there must be a mechanism to remove Ca2+ as well as the excess Na+, and it is thought to be done so through a sodium/calcium exchanger in the membranes of the outer segment of the photoreceptor. Ca2+, once thought to be the second messenger in linking the rhodopsin photoisomerization to the membrane events is now known to have a secondary but important regulatory role in phototransduction. Although it does not directly participate in the transduction cascade it does improve the signaling capability of the rods in speeding the recovery after illumination and down regulating of the rods sensitivity in steady illumination (13). The latter effect is a mechanism for light adaptation. For it must be remembered that a photoreceptor cell does not simply detect light. It can also adapt to environmental light. For example cone photoreceptors can adapt so that our visual system can see from the dim shadows under a tree to objects in bright sunlight snow, a shift of light intensity of 7-9 log units of light intensity (14). Rod photoreceptors, thought at one time not to light adapt, are now known to adapt over a range of 2 log units of background intensity and combined with a network adaptation through the whole visual system, allows as much as 5 log units of background intensity adaptation in rod driven vision (13). An animation of phototransduction appears in movie 3.
4. Phagocytosis of outer segments by pigment epithelium
The stacks of discs containing visual pigment molecules in the outer segments of the photoreceptors are constantly renewed. New discs are added at the base of the outer segment at the cilium as discussed above. At the same time old discs are displaced up the outer segment and are pinched off at the tips and engulfed by the apical processes of the pigment epithelium (Fig. 11, Fig. 12). These discarded, spent discs become known as phagosomes in the pigment epithelial cells. They are then broken down by lysis. Photoreceptor outer segment discs are phagocytosed by the pigment epithelium in a diurnal cycle. There is a burst of disc shedding at light on in the morning, judged by increased numbers of phagosomes in the pigment epithelium shortly thereafter (15). An animation of phototransduction appears in movie 4.
Cone outer segments differ from rod outer segments in several respects. Firstly, they are shorter and more conical with a wider base and tapering shape compared with those of rods. Secondly, as mentioned above, their discs are connected to the plasma membrane throughout the extent of the outer segment, and thus they are open to extracellular space. Apical processes of the pigment epithelium phagocytize chunks of cone outer segments, just as they do the rod outer segments, but at a different time in the diurnal cycle compared with rods i.e. at light off-set compared light-onset (15-19).
5. Different types of cone photoreceptor
As we have seen from the morphological appearances described above, two basic types of photoreceptor, rods and cones, exist in the vertebrate retina (Fig. 13). The rods are photoreceptors that contain the visual pigment - rhodopsin and are sensitive to blue-green light with a peak sensitivity around 500 nm wavelength. Rods are highly sensitive photoreceptors and are used for vision under dark-dim conditions at night. Cones contain cone opsins as their visual pigments and, depending on the exact structure of the opsin molecule, are maximally sensitive to either long wavelengths of light (red light), medium wavelengths of light (green light) or short wavelengths of light (blue light). Cones of different wavelength sensitivity and the consequent pathways of connectivity to the brain are, of course, the basis of color perception in our visual image.
Three different cone mechanisms can be detected in behavioral, psychophysical and physiological testing (Fig. 14A). These mechanisms are the basis of so called trichromatic vision which most humans have. Where only one or two visual pigment bearing types of cone are present the vision is said to be monochromatic or dichromatic.
Most mammalian species are dichromatic containing as well as rods only middle and short wavelength sensitive cones in their retinas. Primates and humans, birds, reptiles and fish are trichromatic, tetrachromatic and some even pentachromatic (within the latter three vertebrate phyla).
Thus long, medium and short wavelength cones have been demonstrated to exist in human retina by photometric, psychophysical and molecular biological methods: L-cones (red) are known to be maximally sensitive to wavelengths peaking at 564nm, M-cones (green) at 533nm and S-cones (blue) at 437nm respectively (Fig14A) (20).
Normal human color vision depends on the three cone mechanisms. This adds an additional dimension to color vision over those of dichromatic mammals, creating reds and greens rather than just long wavelength (red) and short wavelength (blue). To do, this nature splits the long-wave system into two similar systems with slightly different spectral sensitivities with relatively similar opsins (Fig. 14B). One cone opsin is most sensitive to yellow-green and the other to yellow-red. This splits the brightest and yellow part of the visible spectrum into two color bands, one green and the other red. This red-green system works in parallel with that for blue-yellow.
Figure 14B shows the subtle difference in the molecular structure of the red and green cone photopigments compared with either the blue-cone pigment or the rhodopsin rod pigment (21).
To understand color vision and how the colored visual message is processed in the retina we need to be able to start with a morphological distinction of the three (or more) cone types, so they can then, hopefully be identified with any color specific connections they make, i.e. connections to bipolar, horizontal cell and finally ganglion cells of the retina. Fortunately, certain vertebrate species have distinctly different morphological cone types in their retinas and it has recently become possible to correlate these morphologies with spectral sensitivity. Now we can distinguish short, medium and long wavelength cones in retinas of some fish, frogs, birds, and reptiles (turtles) based on distinct morphological differences. Turtle retinas for example have colored oil droplets in their different spectral types of cone which identify them rather readily (Fig. 15, Fig. 16) (22, 23).
However, primate and human retinas still contain cone types which look essentially the same morphologically, but here too with anatomical techniques we are beginning to be able to see at least a difference between the short wavelength cone and the two longer wavelength cones. Specialized histochemical techniques (24), dye uptake studies (25) or use of antibodies specific for visual pigments (26) have allowed identification of the different spectral types of cone in most mammalian species now. In primate retina antibodies against visual pigments stain outer segments of the L/M-cones together or the S-cones only.
In Figure 17, in anti-visual pigment antibody stained tissue, the S-cones stand out as the cones that are not stained because the antibody recognizes only L- and M-cone visual pigment. i.e. the brown stained cone profiles are L- and M-cone types while the unstained profiles surrounded by blue circles are the S-cones (27).
6. Morphology of the blue or S-cones
Careful morphological studies have enabled us to distinguish the short wavelength specific (blue) cone from the medium and long wavelength specific cones in the human retina even without special antibody staining techniques (28).
Thus, we now know that S-cones have longer inner segments that project further into subretinal space than do the longer wavelength cones (Fig 18). S-cone inner segment diameters do not vary much across the entire retina, thus they are fatter in the foveal area but thinner in the peripheral retina than longer wavelength cones. These S-cones also have smaller and morphologically different pedicles than the other two wavelength cones (29). Furthermore, throughout the retina, the S-cones have a different distribution and do not fit into the regular hexagonal mosaic of cones typical of the other two types.
This is illustrated in the tangential section of the foveal cone mosaic (Fig. 19) where the hexagonal packing is distorted in many places by a larger-diameter cone (arrowed cones) breaking up the perfect mosaic into irregular subunits. The larger-diameter cones are S-cones. These cones have their lowest density in the foveal pit at 3-5% of the cones, reach a maximum density of 15% on the foveal slope (1 degree from the foveal pit) and then form an even 8% of the total population elsewhere in the retina (28).
Analogous information concerning relative distributions of the M- and L-cones in the human retina is not easily available because we cannot tell them apart by morphological features or even by anti-visual pigment staining. In the monkey retina, Marc and Sperling (24), performed a colored light-dependent histochemical staining technique on freshly excised monkey eyes. They found that L-cones (red) occur as about 33% of the cones throughout the retina, while M-cones (green) peak in the fovea at 64% and vary between 52% and 59% elsewhere in the retina. However, others have found the L-cones to outnumber the M-cones in fovea and perifoveal psychophysical testing paradigms (30). Laser interferometry techniques (31, 32), measuring the distribution of the red and green cones in the living human fovea, show there to be considerable variation amongst individuals. Some have an equal distribution of L- and M-cones, but others have a larger number of red cones even up to the ratio of 16 L-cones:1 M-cone. Both Roorda and Williams and Hofer et al's (31, 32) data in human and Mollon and Bowmaker (33) in monkey fovea show an irregular and patchwork nature of the L- and M-cone distribution (see chapter on midget pathways, Figure 5).
7. Densities of rods and cones in the human retina
It is important for our understanding of the organization of the visual connections for us to know the spatial distribution of the different cell types in the retina. Photoreceptors, we know, are organized in a fairly exact mosaic. As we saw in the fovea, the mosaic is a hexagonal packing of cones. Outside the fovea, the rods break up the close hexagonal packing of the cones but still allow an organized architecture with cones rather evenly spaced surrounded by rings of rods. Thus in terms of densities of the different photoreceptor populations in the human retina, it is clear that the cone density is highest in the foveal pit and falls rapidly outside the fovea to a fairly even density into the peripheral retina (Fig. 20, Fig. 21) (34, 35). There is a peak of the rod photoreceptors in a ring around the fovea at about 4.5 mm or 18 degrees from the foveal pit. The optic nerve (blind spot) is of course photoreceptor free (see below).
8. Rods and Night Vision
Rods convey the ability to see at night, under conditions of very dim illumination. Animals with high densities of rods tend to be nocturnal, whereas those with mainly cones tend to be diurnal. The nature of dim light is important both to physicists and to biologists. In 1905 Einstein proposed that light propagated only in discrete irreducible packets or quanta (36). This explained the non-classical features of the 'photoelectric effect', a process by which light facilitates the release of electrons from metal surfaces, described by Heinrich Hertz in 1887 (37). Rods are so sensitive that they actually detect single quanta of light, much as do the most sensitive of physical instruments. In 1942 Selig Hecht argued that human rods must be capable of detecting individual light quanta because light flashes so dim that only 1 in 100 rods were likely to absorb a quantum were yet reliably seen by careful observers (38). A century after the original discovery of the photoelectric effect it has become possible to record directly the minute electrical voltages in rods induced by absorption of individual light quanta. An excellent example is shown in the suction electrode recordings of monkey rods by Schneeweis and Schnapf (39) (Fig. 22). Each dot in the figure below represents delivery of a very dim pulse of light containing only a few quanta. Voltage responses appear to come in 3 sizes: none, small, and large, representing the detection of 0, 1 or 2 quanta in each flash. The granularity of response to dim light stimuli is evident.
Rod sensitivity appears to be bought at a price, however, since rods are much slower to respond to light stimulation than cones. This is one reason why sporting events such as baseball become progressively more difficult as daylight fails. Both electrical recordings and human observations suggest that signals from rods may arrive as much as 1/10 second later than those from cones under lighting conditions where both can be simultaneously activated (40).
9. Ultrastructure of rod and cone synaptic endings
The job of the photoreceptor cell in the retina is to catch quanta of light in the visual pigment-containing membranes of the outer segment and pass a message, concerning numbers of quanta of light and sensitivities to the different wavelengths, to the next stage of integration and processing at the outer plexiform layer. The way in which quanta are transformed into electrical signals is developed in the Webvsion chapter on Phototransduction.
The information transmitting end of the cone cell is known as the pedicle and of the rod cell as the spherule. Cone pedicles are large, conical, flat end-feet (8-10 µm diameter) of the cone axon that lie more or less side by side on the same plane at the outer edge of the outer plexiform layer (OPL) (Fig. 23A, Fig. 23B). The more numerous rod spherules, in contrast, are small round enlargements of the axon (3-5 µm diameter) or even extensions of the cell body. They lie packed between and above the cone pedicles (Fig. 23A, Fig. 23B). The synaptic endings of both photoreceptor types are filled with synaptic vesicles. At their synapses to second-order neurons (bipolar and horizontal cells), both rod spherules and cone pedicles exhibit dense structures known as synaptic ribbons pointing to the postsynaptic invaginated processes (asterisks in Fig. 24). In the cone pedicle approximately 30 of these ribbons occur and are associated with 30 "triads" of invaginated processes (29). In the rod spherule 2 ribbons are associated with 4 invaginated second-order neurites while the cone pedicle delivers information to over a hundred second-order neurons (Fig. 23B).
The cone "triad" of invaginated second-order processes consists typically of a central element which is a dendritic terminal of an invaginating bipolar cell (IBC), and two lateral elements which are dendritic terminals of horizontal cells (HC) (Figs. 24, 25, and 27). In addition, other varieties of bipolar cell have dendrites making synaptic contacts on the under surface of the cone pedicle at what were first called flat contacts (FBC) (41-43) (Fig. 27), but then were better characterized and defined by Lasansky (44) as basal junctions (Fig. 26).
Rods spherules have only two synaptic ribbons associated with two lateral elements that are horizontal cell axon terminals (HC) and two central invaginating dendrites of rod bipolar cells (Fig. 28) (35) (41-43). There are no basal junctions on rod spherules.
10. Interphotoreceptor contacts at gap junctions
There also appears to be a pathway for crosstalk between cones and between cones and rods in the human retina. Cone pedicles have small projections from their sides or bases that pass to neighboring rod spherules and cone pedicles. Where these projections, called telodendria, meet they have a specialized junction known to be typical of electrical synaptic transmission. These are minute gap junctions (Fig. 29) (45, 46).
As many as 3-5 gap junctions occur on a single rod spherule from neighboring cone telodendria, and a single cone pedicle can have as many as 10 contacts to neighboring rods. Pedicles of S-cones do not have as many telodendrial gap junctions with either neighboring rods or cones (29) and thus, this cone type remains relatively isolated in the cone mosaic, and, as we shall see later, remains isolated to the ganglion cell level too, due to connections with a specific 'S-cone bipolar cell'.
Direct interactions between different functional classes of photoreceptors were not anticipated based on any known or theoretical needs of the visual system. In fact such connections would appear to degrade spatial resolution, and, potentially, color perception by mixing signals from photoreceptors at different locations or with different photopigments. Nonetheless, in agreement with anatomical findings, mammalian cones appear to carry rod signals. The slow wave forms of rod signals are easily distinguished from the rapid wave forms of cone signals in voltage recordings from single cones. Examples of voltage responses from monkey cones are illustrated in Figure 30 (39). Voltage records resulting from red and green stimuli balanced to produce equal peak responses are illustrated.
Both records exhibit the same initial peak hyperpolarization in response to the brief stimulus, however the green stimulus (solid trace) also evokes a slower hyperpolarizing phase after the initial response which the red stimulus (dotted trace) does not (Fig. 30). This latter electrical wave has the characteristics of a rod signal. Such signals have also been observed in cat cones (47). One theory of the utility of this arrangement is that it allows rods to utilize neural pathways devoted to both cones and rods in sending visual information to the inner plexiform layer. Cone pathways may be tuned to faster temporal characteristics than rod pathways, and so by utilizing both pathways, rods may transmit a wider bandwidth of temporal information. There is evidence for two rod pathways with different dynamic signatures in perceptual experiments (48). Although the functional role of interreceptor junctions is still a matter of debate, they perhaps serve as a philosophical warning to studies of biological sensory systems: Not even the receptor cells themselves stand in isolation of the activity and influence of neighboring neurons.
About the Author
The biosketch for Helga Kolb appears in the Webvision section About the Editors.
References
- 1.
- Anderson D.H., Fisher S.K. The photoreceptors of diurnal squirrels: outer segment structure, disc shedding, and protein renewal. J Ultrastruct Res. 1976;55(1):119–41. [PubMed: 1263298]
- 2.
- Steinberg R.H., Fisher S.K., Anderson D.H. Disc morphogenesis in vertebrate photoreceptors. J Comp Neurol. 1980;190(3):501–8. [PubMed: 6771304]
- 3.
- Deretic D. et al. rab8 in retinal photoreceptors may participate in rhodopsin transport and in rod outer segment disk morphogenesis. J Cell Sci. 1995;108(Pt 1):215–24. [PubMed: 7738098]
- 4.
- Papermaster D.S., Schneider B.G., Besharse J.C. Vesicular transport of newly synthesized opsin from the Golgi apparatus toward the rod outer segment. Ultrastructural immunocytochemical and autoradiographic evidence in Xenopus retinas. Invest Ophthalmol Vis Sci. 1985;26(10):1386–404. [PubMed: 2931395]
- 5.
- Adler A.J., Martin K.J. Retinol-binding proteins in bovine interphotoreceptor matrix. Biochem Biophys Res Commun. 1982;108(4):1601–8. [PubMed: 6891215]
- 6.
- Chader G.J. Interphotoreceptor retinoid-binding protein (IRBP): a model protein for molecular biological and clinically relevant studies. Friedenwald lecture. Invest Ophthalmol Vis Sci. 1989;30(1):7–22. [PubMed: 2643589]
- 7.
- Hargrave P.A., McDowell J.H. Rhodopsin and phototransduction: a model system for G protein-linked receptors. FASEB J. 1992;6(6):2323–31. [PubMed: 1544542]
- 8.
- Hargrave P.A. et al. Rhodopsin's protein and carbohydrate structure: selected aspects. Vision Res. 1984;24(11):1487–99. [PubMed: 6533983]
- 9.
- Archer S., Hope A., Partridge J.C. The molecular basis for the green-blue sensitivity shift in the rod visual pigments of the European eel. Proc Biol Sci. 1995;262(1365):289–95. [PubMed: 8587887]
- 10.
- Fu, Y., Phototransduction in Rods and Cones, in Webvision: The Organization of the Retina and Visual System, H. Kolb, E. Fernandez, and R. Nelson, Editors. 2010: Salt Lake City (UT).
- 11.
- Kawamura, S., Photransduction, excitation and adaptation., in Neurobiology and clinical aspects of the outer retina, M.B.A. Djamgoz, S.N. Archer, and S. Vallerga, Editors. 1995, Chapman & Hall: London; New York. p. 105-131.
- 12.
- Stryer L. Visual excitation and recovery. J Biol Chem. 1991;266(17):10711–4. [PubMed: 1710212]
- 13.
- Yau K.W. Phototransduction mechanism in retinal rods and cones. The Friedenwald Lecture. Invest Ophthalmol Vis Sci. 1994;35(1):9–32. [PubMed: 7507907]
- 14.
- Normann, R.A., I. Perlman, and P.E. Hallet, Cone photoreceptor physiology and cone contributions to colour vision., in The perception of colour P. Gouras, Editor. 1991, Macmillan Press Ltd.: London. p. 146-162.
- 15.
- Young R.W. The renewal of rod and cone outer segments in the rhesus monkey. J Cell Biol. 1971;49(2):303–18. [PMC free article: PMC2108322] [PubMed: 19866760]
- 16.
- Besharse J.C. Chapter 3 The daily light-dark cycle and rhythmic metabolism in the photoreceptor—Pigment epithelial complex. Progress in Retinal Research. 1982;1(0):81–124.
- 17.
- LaVail M.M. Rod outer segment disk shedding in rat retina: relationship to cyclic lighting. Science. 1976;194(4269):1071–4. [PubMed: 982063]
- 18.
- Steinberg R.H., Wood I., Hogan M.J. Pigment epithelial ensheathment and phagocytosis of extrafoveal cones in human retina. Philos Trans R Soc Lond B Biol Sci. 1977;277(958):459–74. [PubMed: 16301]
- 19.
- Young R.W. Visual cells and the concept of renewal. Invest Ophthalmol Vis Sci. 1976;15(9):700–25. [PubMed: 986765]
- 20.
- Gouras P. Chapter 8 Color vision. Progress in Retinal Research. 1984;3(0):227–261.
- 21.
- Nathans J., Thomas D., Hogness D.S. Molecular genetics of human color vision: the genes encoding blue, green, and red pigments. Science. 1986;232(4747):193–202. [PubMed: 2937147]
- 22.
- Ammermüller J., Kolb H. Functional architecture of the turtle retina. Progress in Retinal and Eye Research. 1996;15(2):393–433.
- 23.
- Kolb, H. and L.E. Lipitz, The anatomical basis for colour vision in the vertebrate retina., in The perception of colour., P. Gouras, Editor. 1991, Macmillan Press Ltd.: London. p. 128-145.
- 24.
- Marc R.E., Sperling H.G. Chromatic organization of primate cones. Science. 1977;196(4288):454–6. [PubMed: 403607]
- 25.
- DeMonasterio F.M., Schein S.J., McCrane E.P. Staining of blue-sensitive cones of the macaque retina by a fluorescent dye. Science. 1981;213(4513):1278–81. [PubMed: 7268439]
- 26.
- Szel A., Diamantstein T., Rohlich P. Identification of the blue-sensitive cones in the mammalian retina by anti-visual pigment antibody. J Comp Neurol. 1988;273(4):593–602. [PubMed: 3209737]
- 27.
- Wikler K.C., Rakic P. Distribution of photoreceptor subtypes in the retina of diurnal and nocturnal primates. J Neurosci. 1990;10(10):3390–401. [PMC free article: PMC6570186] [PubMed: 2145402]
- 28.
- Ahnelt P.K., Kolb H., Pflug R. Identification of a subtype of cone photoreceptor, likely to be blue sensitive, in the human retina. J Comp Neurol. 1987;255(1):18–34. [PubMed: 2434534]
- 29.
- Ahnelt P., Keri C., Kolb H. Identification of pedicles of putative blue-sensitive cones in the human retina. J Comp Neurol. 1990;293(1):39–53. [PubMed: 2312791]
- 30.
- Cicerone C.M., Nerger J.L. The relative numbers of long-wavelength-sensitive to middle-wavelength-sensitive cones in the human fovea centralis. Vision Res. 1989;29(1):115–28. [PubMed: 2773329]
- 31.
- Hofer H. et al. Organization of the human trichromatic cone mosaic. J Neurosci. 2005;25(42):9669–79. [PMC free article: PMC6725723] [PubMed: 16237171]
- 32.
- Roorda A., Williams D.R. The arrangement of the three cone classes in the living human eye. Nature. 1999;397(6719):520–2. [PubMed: 10028967]
- 33.
- Mollon J.D., Bowmaker J.K. The spatial arrangement of cones in the primate fovea. Nature. 1992;360(6405):677–9. [PubMed: 1465131]
- 34.
- Curcio C.A. et al. Distribution of cones in human and monkey retina: individual variability and radial asymmetry. Science. 1987;236(4801):579–82. [PubMed: 3576186]
- 35.
- Østerberg G. Topography of the layer of rods and cones in the human retina. Acta ophthalmol. 1935;13(S6):11–103.
- 36.
- Einstein A. On a Heuristic Viewpoint Concerning the Production and Transformation of Light. Annalen der Physik. 1905;17(6):132–148.
- 37.
- Hertz H. Ueber den Einfluss des ultravioletten Lichtes auf die electrische Entladung. Annalen der Physik. 1887;267(8):983–1000.
- 38.
- Hecht S., Shlaer S., Pirenne M.H. Energy, Quanta, and Vision. J Gen Physiol. 1942;25(6):819–40. [PMC free article: PMC2142545] [PubMed: 19873316]
- 39.
- Schneeweis D.M., Schnapf J.L. Photovoltage of rods and cones in the macaque retina. Science. 1995;268(5213):1053–6. [PubMed: 7754386]
- 40.
- MacLeod D.I. Rods cancel cones in flicker. Nature. 1972;235(5334):173–4. [PubMed: 4551230]
- 41.
- Dowling J.E., Boycott B.B. Organization of the primate retina: electron microscopy. Proc R Soc Lond B Biol Sci. 1966;166(2):80–111. [PubMed: 4382694]
- 42.
- Kolb H. Organization of the outer plexiform layer of the primate retina: electron microscopy of Golgi-impregnated cells. Philosophical Transactions of the Royal Society, London, B. 1970;258:261–283. [PubMed: 22408829]
- 43.
- Missotten, L., The ultrastructure of the human retina1965, Brussel: Arscia Uitgaven. 184 p.
- 44.
- Lasansky A. Synaptic Organization of Cone Cells in the Turtle Retina. Philosophical Transactions of the Royal Society of London. B, Biological Sciences. 1971;262(844):365–381.
- 45.
- Nelson, R., et al., Spectral Mechanisms in Cat Horizontal Cells, in Neurocircuitry of the retina : a Cajal memorial, A. Gallego, Editor. 1985, Elsevier: New York. p. 109-121.
- 46.
- Raviola E., Gilula N.B. Intramembrane organization of specialized contacts in the outer plexiform layer of the retina. A freeze-fracture study in monkeys and rabbits. J Cell Biol. 1975;65(1):192–222. [PMC free article: PMC2111162] [PubMed: 1127010]
- 47.
- Nelson R. Cat cones have rod input: a comparison of the response properties of cones and horizontal cell bodies in the retina of the cat. J Comp Neurol. 1977;172(1):109–35. [PubMed: 838876]
- 48.
- Sharpe L.T., Stockman A., MacLeod D.I. Rod flicker perception: scotopic duality, phase lags and destructive interference. Vision Res. 1989;29(11):1539–59. [PubMed: 2635479]
- 49.
- Brown P.K., Wald G. Visual Pigments in Human and Monkey Retinas. Nature. 1963;200:37–43. [PubMed: 14074625]
- 50.
- Dowling, J.E., The retina: an approachable part of the brain. 1987, Cambridge (MA): Belknap Press of Harvard University Press.
- 51.
- Lasansky A. Cell junctions at the outer synaptic layer of the retina. Invest Ophthalmol. 1972;11(5):265–75. [PubMed: 4112852]
Figures

Movie 1
A photoreceptor with emphasis on the inner and outer segments and the disc structures within the outer segment. Movie made by Carlos Rozas (Canal Web, Chile).
Download video (457K)
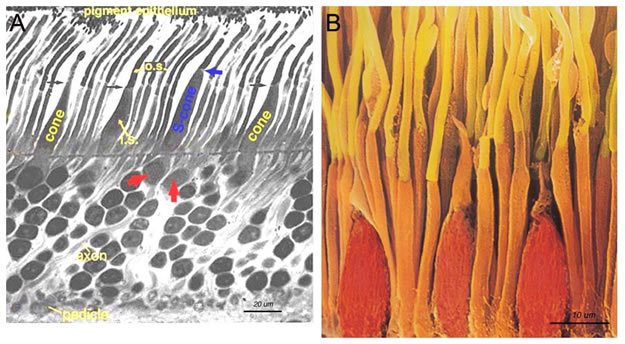
Figure 1. Primate rods and cones. A. Semi-thin section of human outer retina to show the rods and cones. Short-wavelength S-cones (blue cones) are commonly found occurring next to a neighboring longer-wavelength cone (red arrows). B. Scanning electron micrograph of the rods and cones of the primate retina. The image is adapted from one by Ralph C. Eagle of Photo Researchers, Inc.
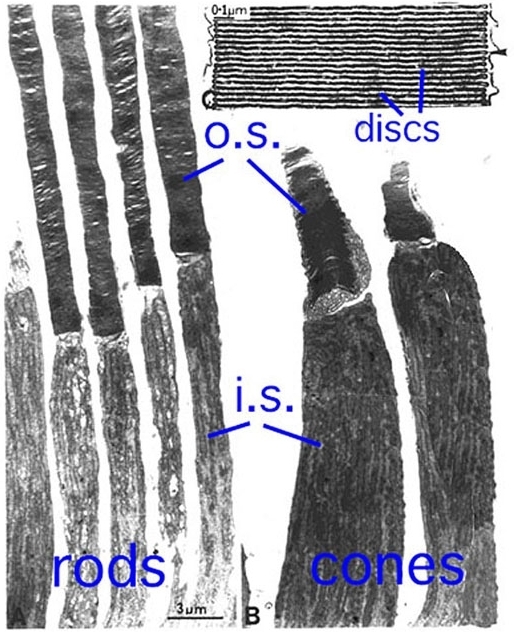
Figure 2. Low magnification EM image of monkey rods and cones with an enlargement of the outer segment discs.
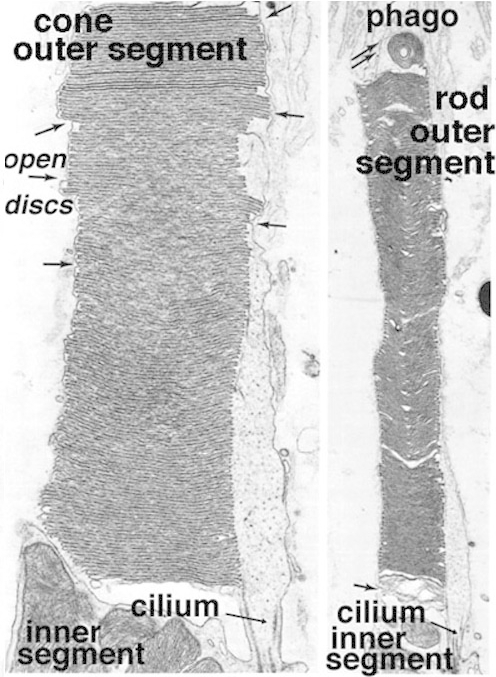
Figure 3. High magnification EM images of cone and rod outer segments in the ground squirrel retina. Phago, phagosome. The illustration is from Anderson and Fisher, 1976 (1).
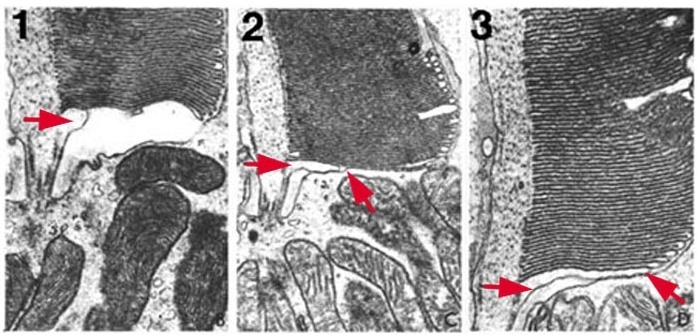
Figure 4. Photoreceptor outer segments are generated at the cilium (red arrows). The illustration is adapted from Steinberg, Fisher and Anderson, 1980 (2).
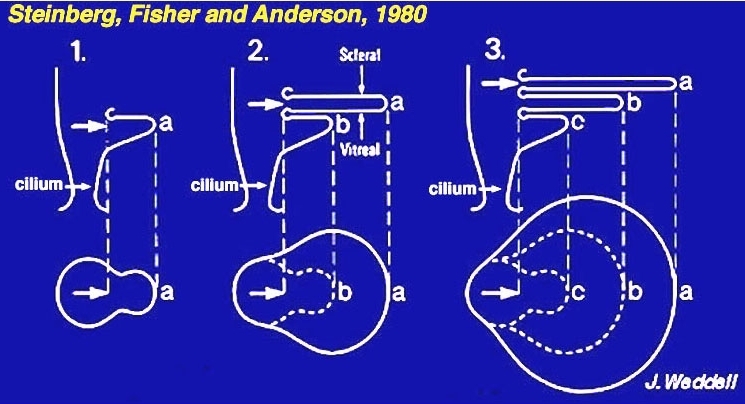
Figure 5. Diagram of outer segment generation. The schema is from Steinberg, Fisher and Anderson, 1980 (2).
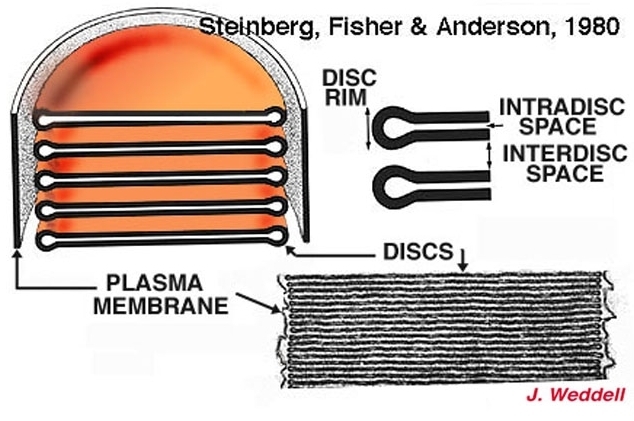
Figure 6. Drawing and micrograph of rod outer segment discs. The illustration is from Steinberg, Fisher, and Anderson, 1980 (2).
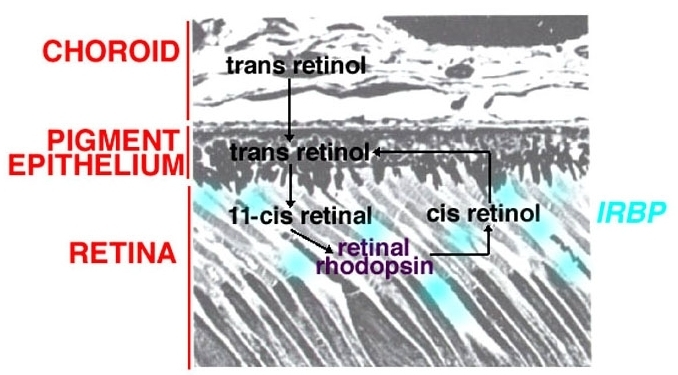
Figure 7. The location of interphotoreceptor retinal binding proteins (6) lies between the pigment epithelium and the photoreceptor outer segments. This region is know as the interphotoreceptor matrix..
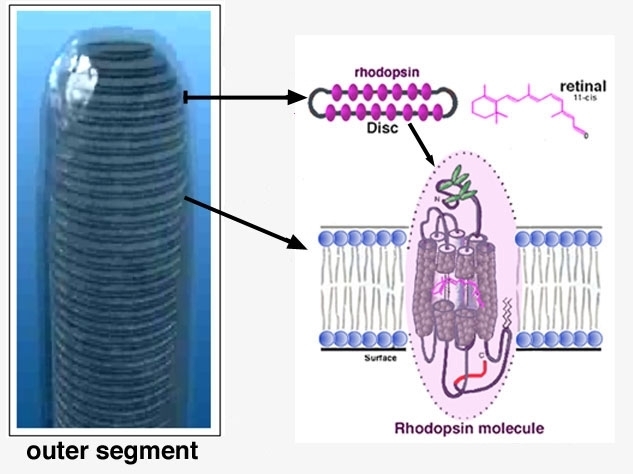
Figure 8. Schematic diagram of rhodopsin in the outer segment discs.
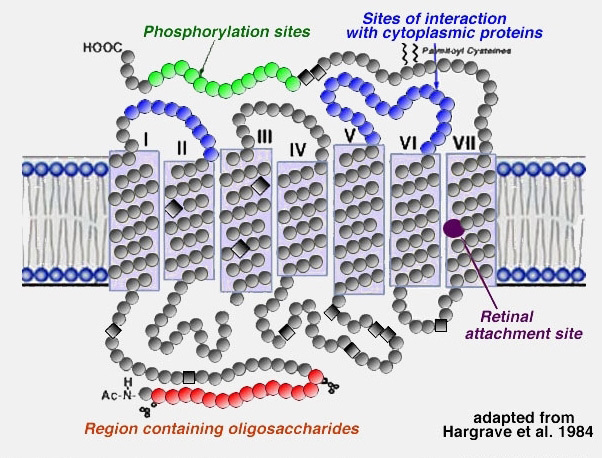
Figure 9. Structural model of rhodopsin showing seven transmembrane domains and the attachment site for retinal. The figure is adapted from Hargrave et al, 1984 (8)
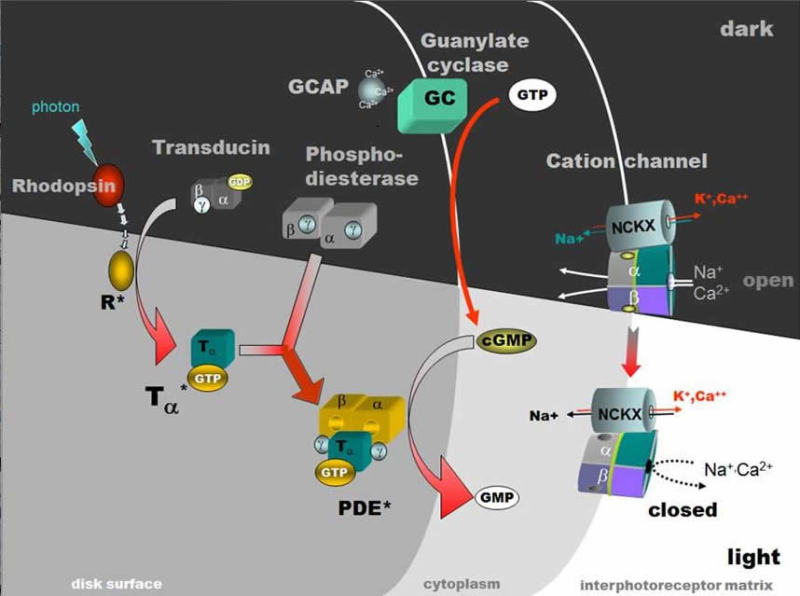
Figure 10. Activation of rhodopsin by light and the phototransduction cascade. Light transduces the visual pigment via the following enzyme cascade: photons – rhodopsin – activated rhodopsin (R+) (metarhodopsin II) – a GTP binding protein (Tα*) (transducin) – an enzyme hydrolyzing cGMP (cGMP-phosphodiesterase, PDE*) – closes membrane bound cGMP-gated cation channel (lower right). The illustration is courtesy of Wolfgang Baehr..

Figure 11. Section through an RPE cell to show stages of outer segment phagocytosis. p.e., pigment epithelium; phag, phagosome. The illustration is from Steinberg, Wood and Hogan, 1977 (18).
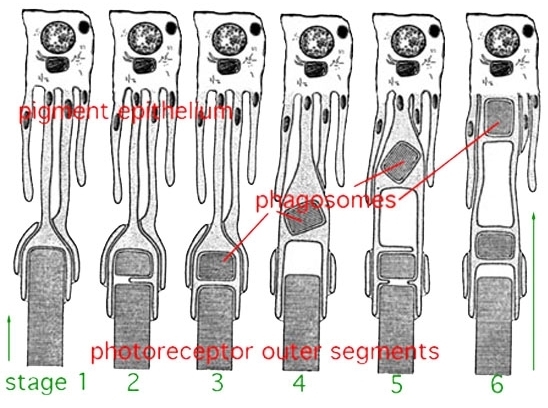
Figure 12. Diagrammatic representation of disc shedding and phagosome retrieval into the pigment epithelial cell.

Figure 13. Photoreceptor types. There are four photoreceptor types in the human retina. Short-wavelength cones (blue), medium-wavelength cones (green), long-wavelength cones (red) and rods..
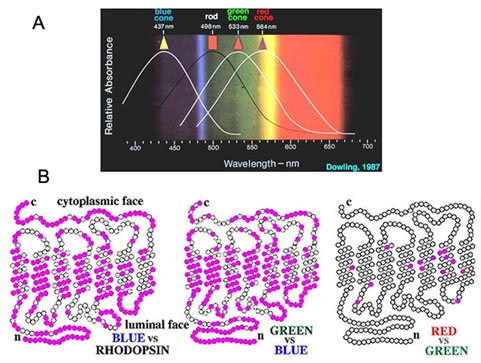
Figure 14. Opsin molecules: different spectra and different amino acid sequences. A. Light Spectra and visual pigment absorbance. The peak spectral sensitivities of the 3 cone types and the rods in the primate retina first published by Brown and Wald, 1963 (49). The illustration is from Dowling, 1987 (50). B. The closely related molecular structures of cone opsins. The blue-cone opsin compared with rhodopsin (left). The blue-cone opsin compared with the green-cone opsin (center). A comparison of red and green-cone opsins (right) reveals only minimal differences. The pink filled circles represent amino acid substitutions between compared opsins. The open circles indicate identical amino acids. The illustration is adapted from Nathans et al., 1986 (21).
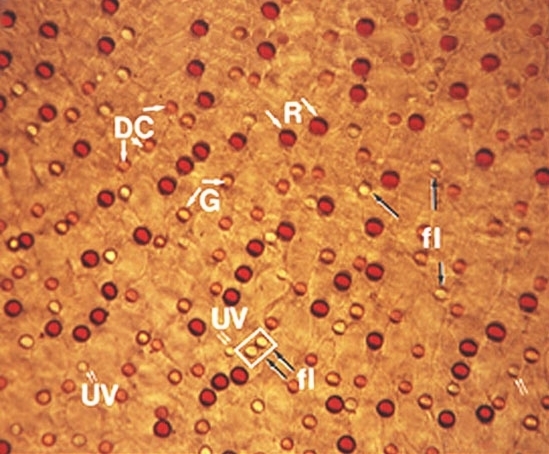
Figure 15. Turtle cone oil droplets. DC, double cone with orange oil droplet; B, green cone with yellow oil droplet; R, red cone with red oil droplet; fl, blue cone with a fluorescent oil droplet; UV, ultraviolet absorbing cone with a clear small oil droplet.
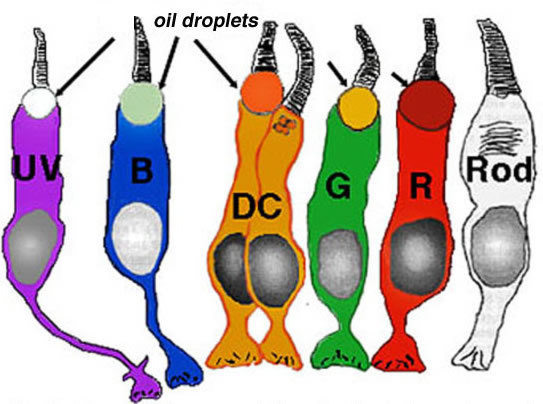
Figure 16. Diagramatic representation of turtle photoreceptors and their associated oil droplets. UV, UV cone; B, blue cone; DC, double cone; G, green cone; R, red cone; Rod, rod (no oil droplet).

Figure 17. Primate cone mosaic as revealed by anti-cone opsin immunostaining. Cones that do not stain brown are blue cones (blue circles). The illustration is from Wikler and Rakic, 1990 (27).

Figure 18. Vertical section of human retina to show the differences between L/M cones and S-cones (blue or B-cones). o.s., cone outer segments; i.s. cone inner segment; cb, cell body; OLM, outer limiting membrane; OPL, outer plexiform layer.
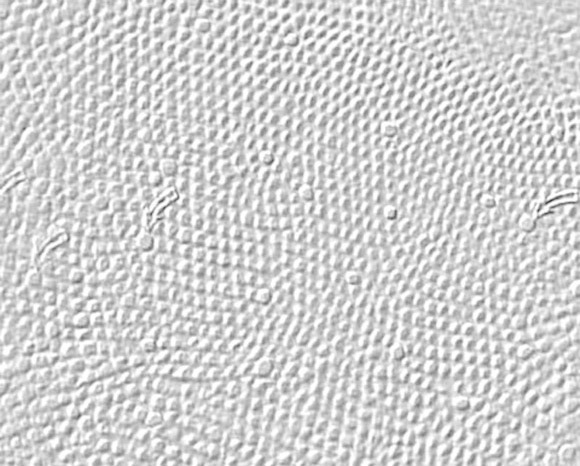
Figure 19. Tangential section through the human fovea. The larger cones (arrows) are blue cones. The figure is from Ahnelt, Kolb and Pflug, 1987 (28).
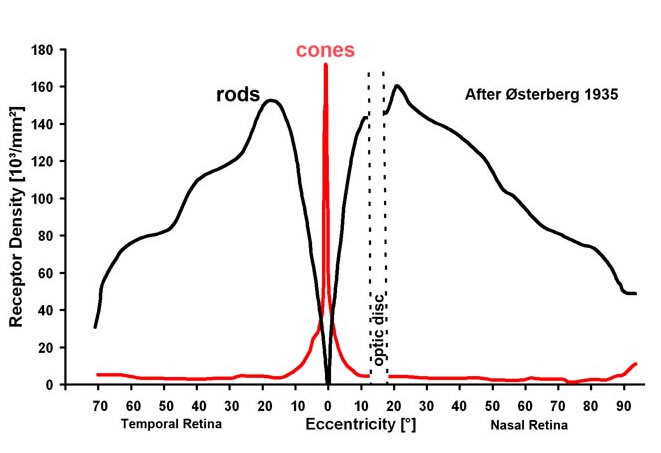
Figure 20. Graph to show rod and cone densities along the horizontal meridian. The illustration is adapted from Østerberg, 1935 (35).
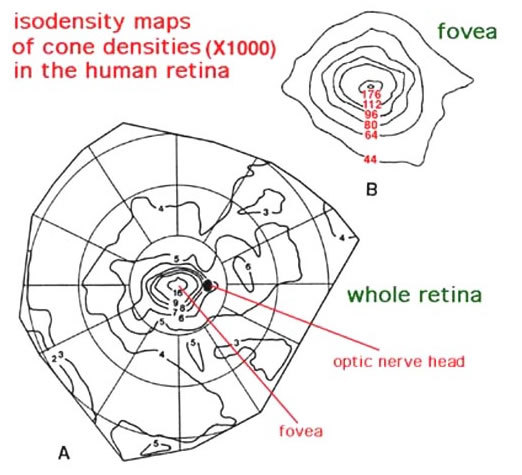
Figure 21. Cone densities in human retina as revealed in whole mount (A). The foveal area is enlarged in B. Adapted from Curcio et al, 1987 (34).
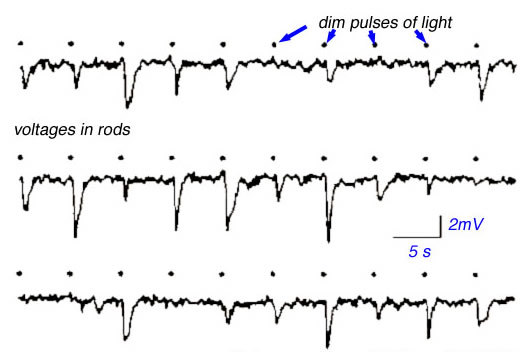
Figure 22. Photovoltages recorded in monkey rods. The illustration is from Schneeweis and Schnapf, 1995 (39).
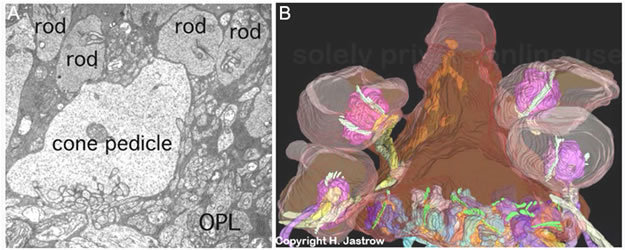
Figure 23. Ultrastructure of the cone synaptic pedicle. A. EM picture of cone pedicle and rod spherules in cat retina. B. Reconstruction from electron microscopy of a cone pedicle (center) surrounded by rod spherules. The illustration in B is courtesy of Holger Jastrow, Department of Anatomy and Cell Biology, University of Mainz, Germany.
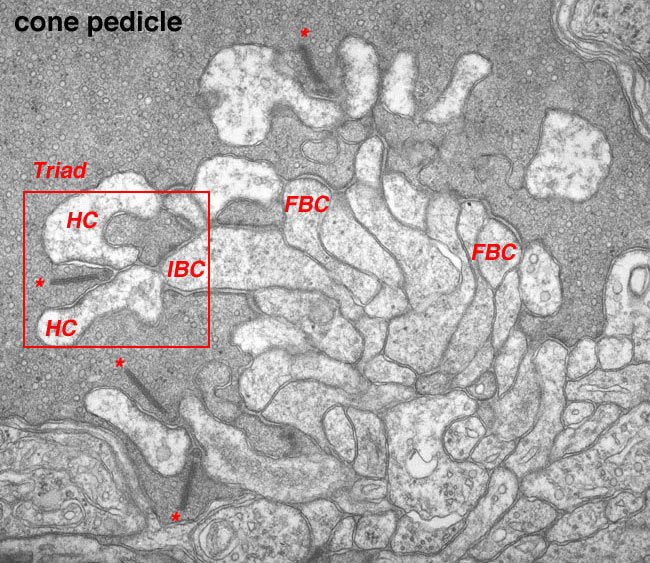
Figure 24. Electron micrograph of a cone pedicle in the turtle retina. The triad synapse is outlined in red. This is composed of 2 horizontal cell (HC) dendrites and an invaginating cone bipolar (IBC) dendrite. FBC: flat bipolar contacts. The picture is courtesy of Arnaldo Lasansky, NIH.
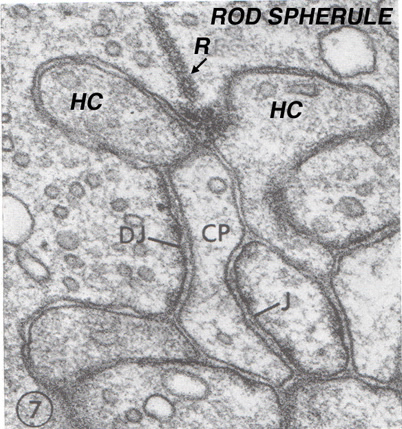
Figure 25. Electron micrograph of a rod spherule in the monkey retina. R, ribbon; HC, horizontal cell processes; DJ, distal junction; CP, central process; J. Junction. The figure is from Lasansky, 1972 (51).
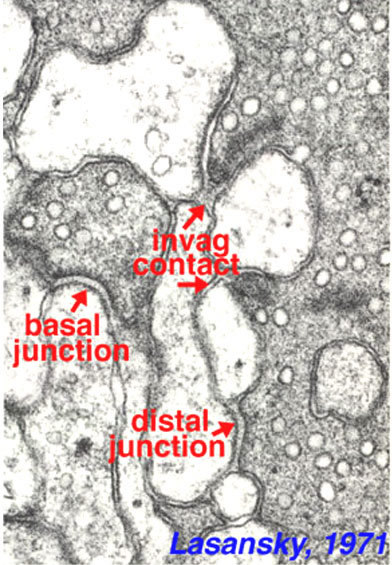
Figure 26. Electron micrograph of a turtle cone pedicle and types of bipolar synaptic contacts (junctions) at the ribbon synapse. The figure is from Lasansky, 1971 (44).
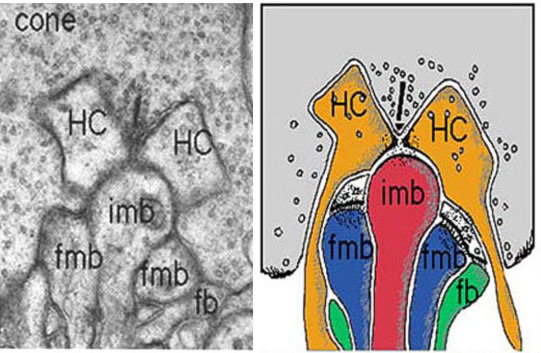
Figure 27. Electron micrograph of a cone triad and a drawing to show bipolar contacts in human. imb, invaginating midget bipolar dendrite; fmb, flat midget bipolar dendrite; HC, horizontal cell dendrite; fb, flat diffuse bipolar dendrite.
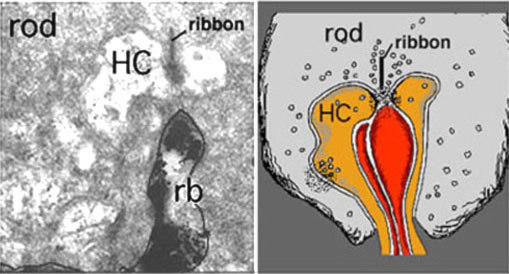
Figure 28. Electron micrograph and drawing of a rod triad in monkey. rb, rod bipolar dendrite; HC, horizontal cell axon terminal processes.

Figure 29. Tiny “kissing” gap junctions between two cones (left) and between rods and cones (right). The electron micrograph is courtesy of Avery H Nelson, NIH (45).
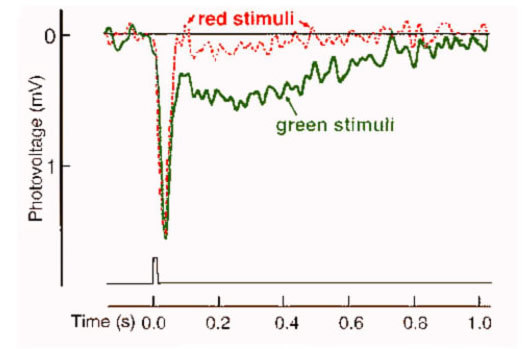
Figure 30. Voltage recording from a monkey cone with red and green stimuli balanced to elicit equal peak amplitudes. The green stimulus (solid trace) also evokes a slower hyperpolarizing phase after the initial response which the red stimulus (dotted trace) does not. The slow electrical wave has the characteristics of a rod signal. The illustration is from Schneeweis and Schnapf, 1995 (39).